Forked and authored by Daniel Ribaudo.
This is an iterated version of my project. Because I received no feedback from students at the time I made it, I simply made several of the improvements I had listed as "Next steps"
The data visualized comes from this gist: Video Game Sales
Within this dataset, there is a listing of video game sales per country. Each video game listed is labelled with a genre, year, publisher, and platform.
Description:
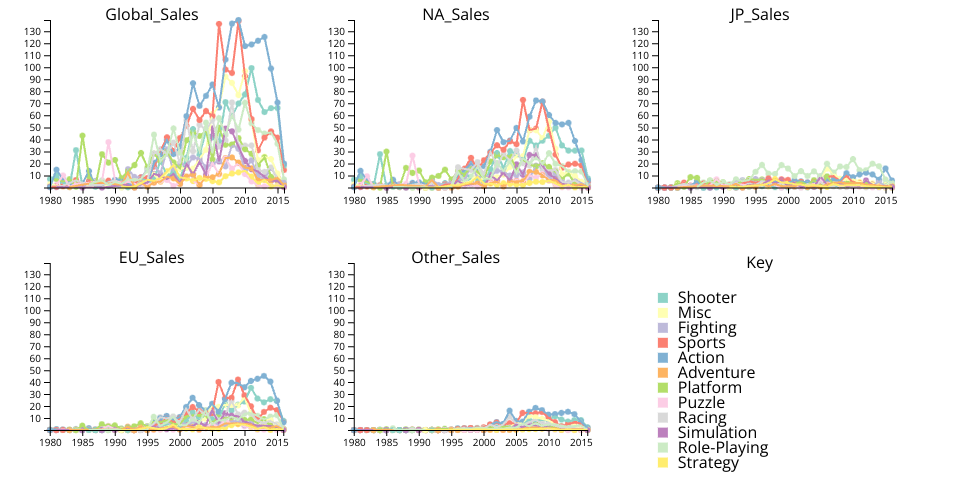
Each chart is sales for each genre of video game plotted against time. The first chart is global sales, the second is North America, third is Japan, fourth is the EU, and finally all other sales. A user may click on the graph to form a crosshair on their cursor. This functionality more easily allows points to be compared across charts.
Description (New Changes):
The key visually maps colors to each genre. Hovering over text within the key highlights the corresponding lines/circles by making them much thicker. Clicking on the next hides/shows the lines/circles corresponding to that genre.
On the technical side, the data aggregation is only done once, allowing points/graphs to be rendered much more quickly after the initial calculation. Many of the magic values now lie within named constants.
Finally, titles were added to the top of each graph to show what sales they corresponded to within the data.
Next steps:
- The ability to toggle each graph and re-render
- The ability to render different data within the csv
- Zoom and drag (seems to be a native svg function)