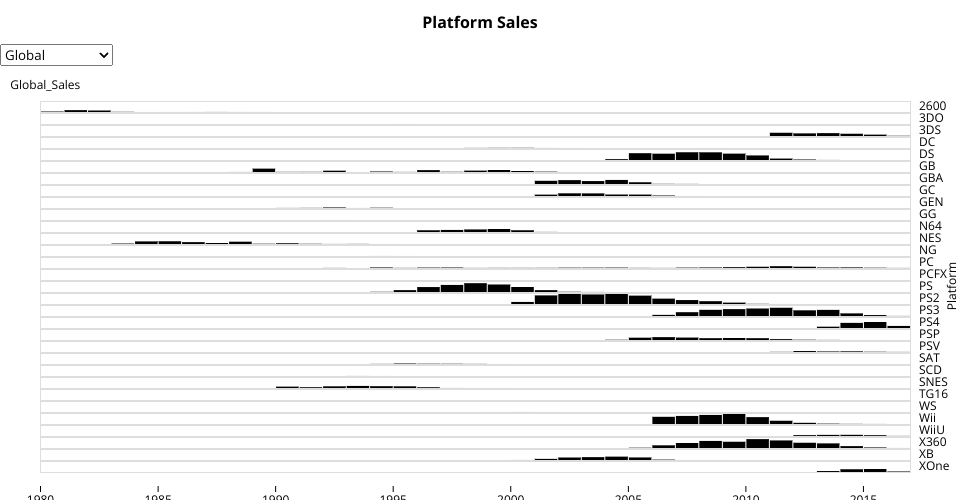
This is a box and whisker graph that represents platform sales over the years. The center line within the box represents the highest sales mean (weighted by year). To create this data, I added the sales for each year together and rounded up for each platform. If platform P had sales S in year Y, then I added S data entries with the information {P,Y}. Finally, I used ObservableHQ code in BoxPlot.js to draw the box plots based on the median and quartiles.
An exploration of the Video Game Sales Dataset prepared by Daniel Ribaudo, originally visualized in Line Graph: vgsales.csv.
Uses Observable Plot with vanilla HTML.
MIT Licensed