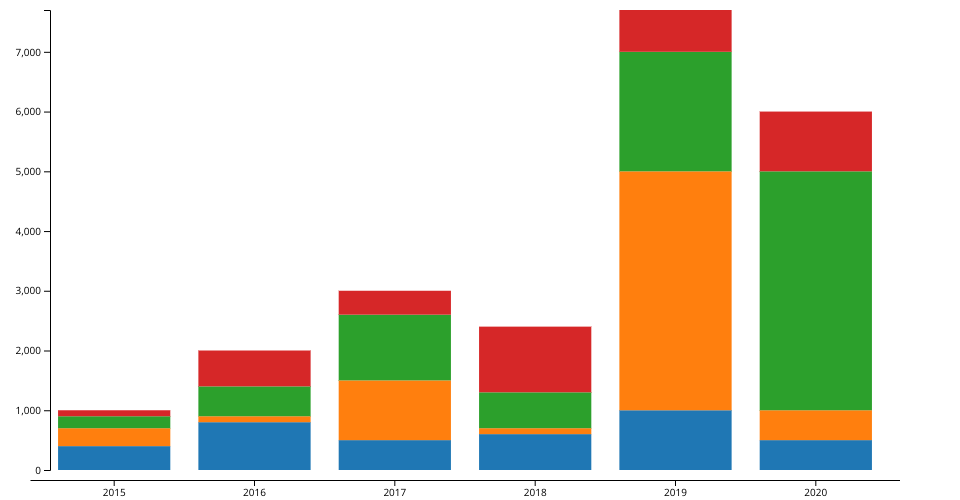
Pseudo-Visualization: Stacked bar chart
Using data { year: '2015', total: 1000, Poster: 300, Lithograph: 200, Graphite: 400, Paint: 100, }, this pseudo-visualization shows the number of artworks by year, and each color represents the medium used.
Reference: https://observablehq.com/@thetylerwolf/day-9-stacked-bar-chart
MIT Licensed