Resources
Contact
Pricing
🇺🇸
EN
Log in
Open Editor
Revision History
Export Image
Share
Line Plot
1
Fork
0
Likes
HollyClarke19
0 views in last 90 days
Last edited Mar 23, 2021
Created on Mar 23, 2021
Forked from
Working with Time
uses
v2 runtime
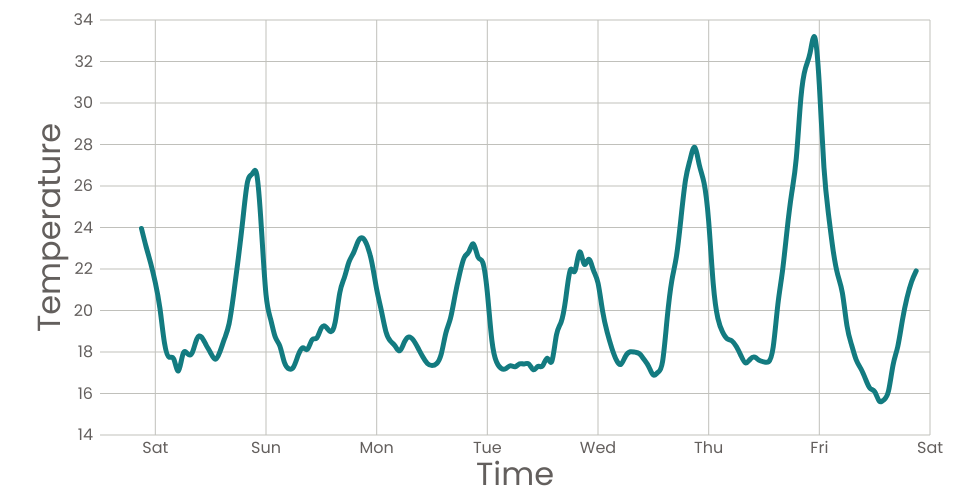
A line plot showing the 'data canvas sense your city' dataset using D3 and React.
MIT Licensed