Reusable Scatter Plot
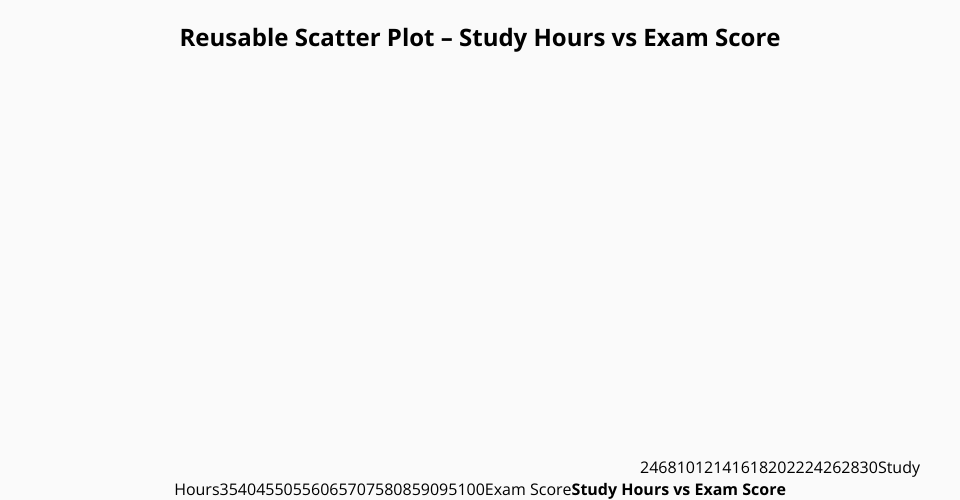
This project demonstrates a reusable scatter plot component built with D3.js that visualizes the relationship between study hours and exam scores.
Usage
- Create a CSV file named
scatter_data.csvwith the provided data - Import the
scatterPlotfunction fromscatterPlot.js - Configure the chart with your data and settings
- Call it on a D3 selection
Features
- Reusable chart component
- Automatic scaling of axes
- Configurable dimensions, margins, and labels
- Clean visualization of data points
MIT Licensed