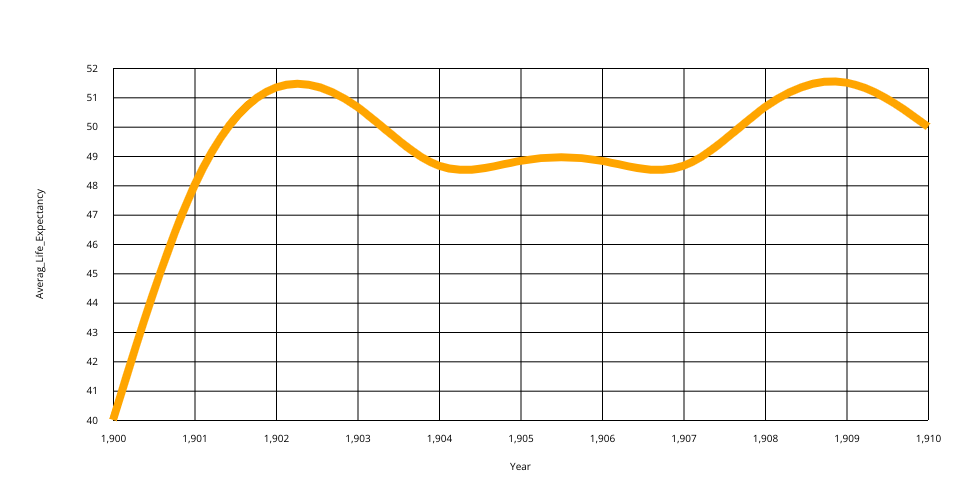
This line chart shows one week of temperature (in degrees Celcius) in San Francisco. The data comes from Data Canvas - Sense Your City.
Made in this video:
MIT Licensed
This line chart shows one week of temperature (in degrees Celcius) in San Francisco. The data comes from Data Canvas - Sense Your City.
Made in this video: