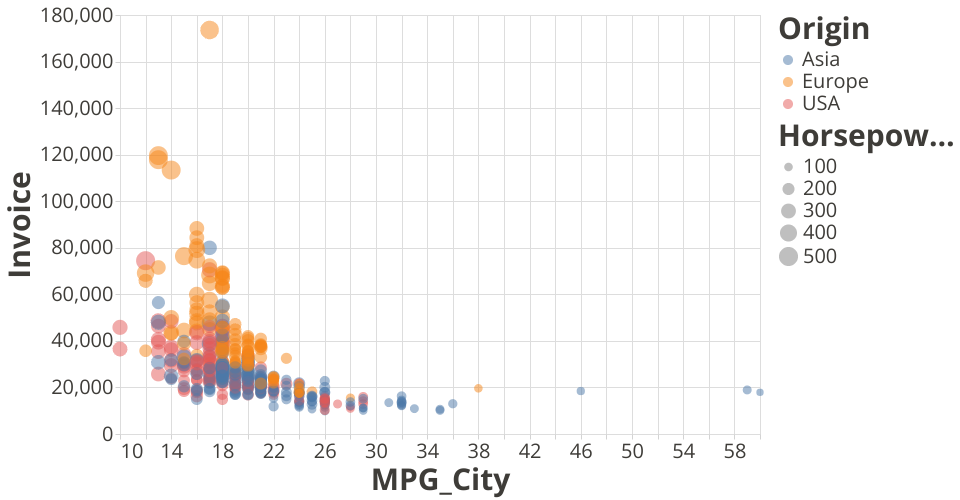
A scattered plot constructed using the vega-lite-api. This visualization shows The cars Dataset.
It's designed to emphasize clustering by horse power and origin.
Each circle represents a car model.
MIT Licensed
A scattered plot constructed using the vega-lite-api. This visualization shows The cars Dataset.
It's designed to emphasize clustering by horse power and origin.
Each circle represents a car model.