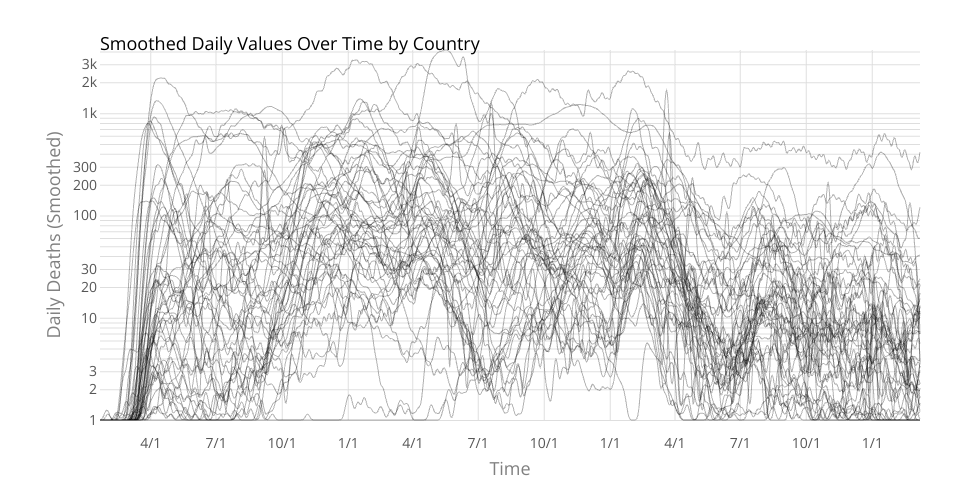
Line chart of cases by country. Data from Johns Hopkins Coronavirus Dataset.
Hover to see details and illuminate lines.
This variant shows values smoothed using a Gaussian kernel blur
MIT Licensed
Line chart of cases by country. Data from Johns Hopkins Coronavirus Dataset.
Hover to see details and illuminate lines.
This variant shows values smoothed using a Gaussian kernel blur