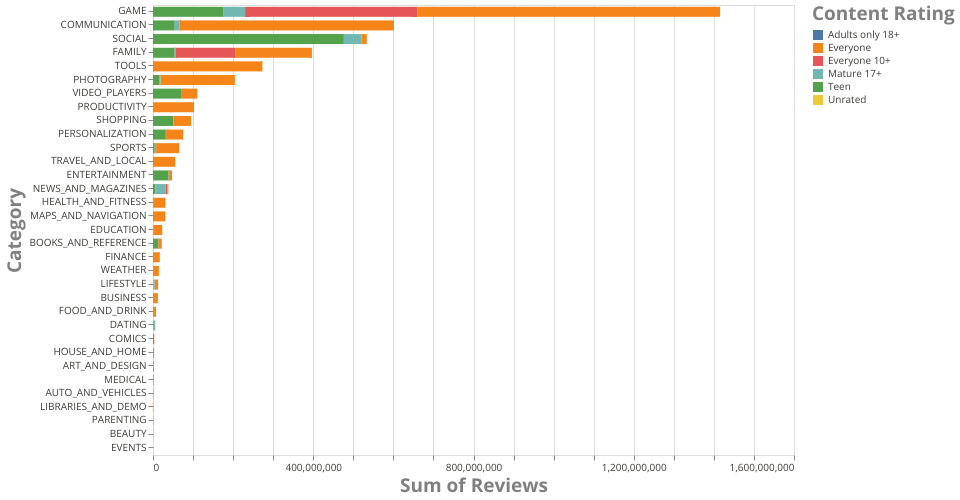
This is a bar chart showing Google Play Store Apps dataset.
It's mainly designed to show the Number of Reviews for different App Category.
Each bar represents one App category. Each color represents the youngest age group that can rate the app.
MIT Licensed