Resources
Contact
Pricing
🇺🇸
EN
Log in
Open Editor
Revision History
Export Image
Share
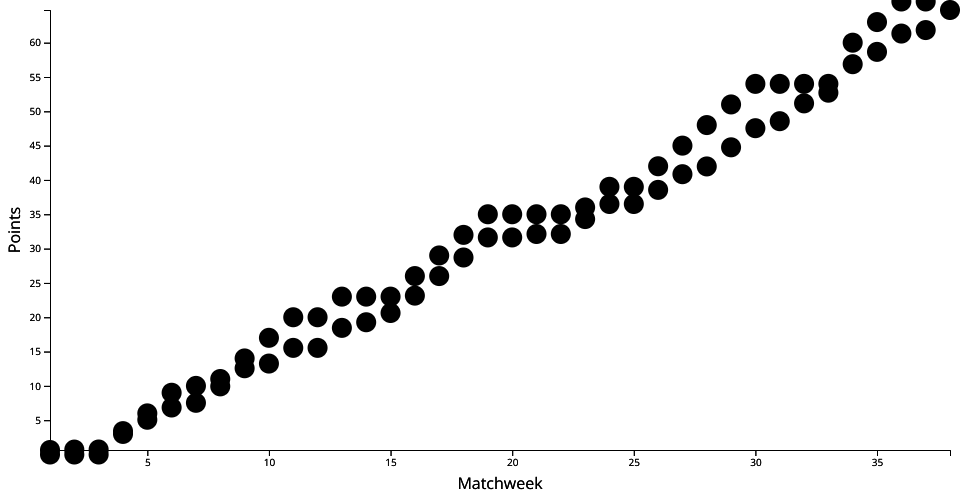
Scatter Plot PL xG Data with both xP and Points
2
Forks
0
Likes
Matthew Dzwil
0 views in last 90 days
Last edited Feb 20, 2023
Created on Feb 20, 2023
Forked from
Scatter Plot PL xG Data
uses
v2 runtime
A scatter plot of the PL xG data with axes.
Help from:
https://observablehq.com/@d3/d3-scaleordinal
MIT Licensed