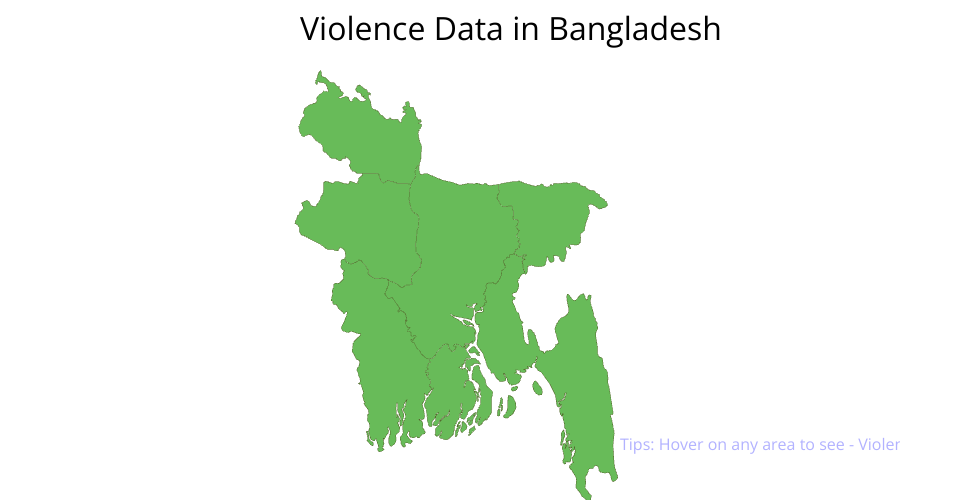
Bangladesh map interaction with sales data
The problem is to visualize sales data on Bangladesh map.
What I have done:
- Parsed topoJson Data to generate Map with geoJson from D3.
- Parsed sales data and maped with each District
- Constructed String for Hover data
- Applied Zoom and Drag feature as required
TopoJSON Data for Bangladesh:
https://raw.githubusercontent.com/techslides/D3-Maps/master/data/world/country/Bangladesh.topo.json
Sales Data :
  [
     {
        "id":1,
        "yearly":"627543.12 BDT",
        "monthly":"56014.56 BDT",
        "weekly":"640.99 BDT",
        "name":"Dhaka"
     },
     {
        "id":2,
        "yearly":"7345.12 BDT",
        "monthly":"53464.56 BDT",
        "weekly":"39.99 BDT",
        "name":"Khulna"
     },
     {
        "id":3,
        "yearly":"67843.12 BDT",
        "monthly":"564.56 BDT",
        "weekly":"89.99 BDT",
        "name":"Barisal"
     },
     {
        "id":4,
        "yearly":"2134435.12 BDT",
        "monthly":"623.56 BDT",
        "weekly":"98.99 BDT",
        "name":"Chittagong"
     },
     {
        "id":5,
        "yearly":"55585.12 BDT",
        "monthly":"354.56 BDT",
        "weekly":"6.99 BDT",
        "name":"Sylhet"
     },
     {
        "id":6,
        "yearly":"223.12 BDT",
        "monthly":"54.56 BDT",
        "weekly":"0.99 BDT",
        "name":"Rajshahi"
     },
      {
        "id":7,
        "yearly":"3223.12 BDT",
        "monthly":"64.56 BDT",
        "weekly":"8.99 BDT",
        "name":"Rangpur"
     }
  ]
Author Profiles:
- Codepen : http://codepen.io/emon535
- Linkedin : https://www.linkedin.com/in/emon535/
- Github : https://github.com/emon535
MIT Licensed