First Project Prototype – Sleep & Stress Bar Chart
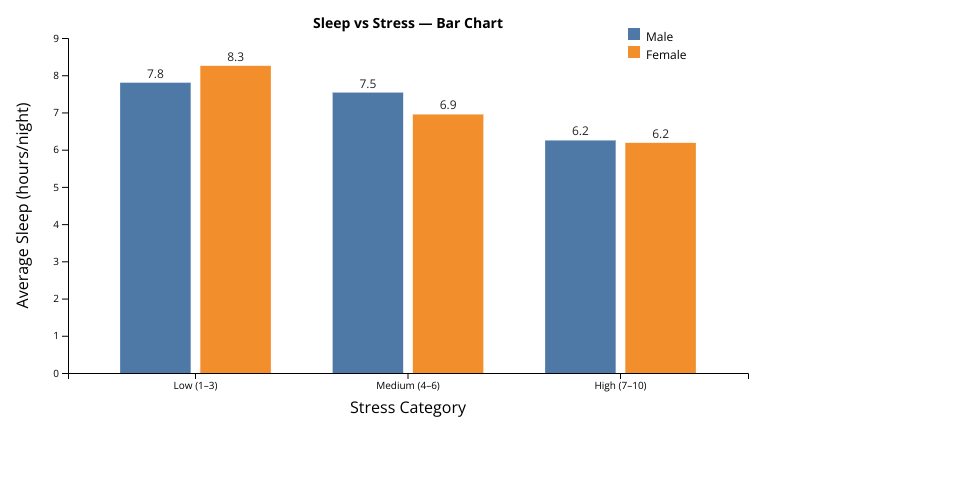
Goal. Use a new technique (bar chart) to show how average sleep hours vary across stress categories, split by gender.
Dataset. Sleep Health & Lifestyle (survey). Columns
used: Sleep Duration (hours/night), Stress Level (1–10),
Gender.
Encoding.
- X: Stress Level binned → Low (1–3), Medium (4–6), High (7–10)
- Y: Average Sleep Duration (hours/night)
- Color: Gender (Male, Female)
- Labels: 1-decimal averages; annotation marks the lowest group
Key Insight. Higher stress is associated with fewer sleep hours; females are slightly lower than males in each bin.
Limitations. Prototype summarizes with simple means; no distribution, CIs, or confounders (age, BMI, caffeine) yet.
Next Steps. Add error bars (±SE), tooltips, and an interactive control to switch statistic (mean/median) or grouping.
MIT Licensed