Sleep Duration vs Stress Level (Scatter Plot)
Dataset
This visualization uses the
Sleep Health and Lifestyle Dataset
from Kaggle.
It includes 374 individuals with information on
demographics, sleep duration, stress levels, lifestyle
factors, and sleep disorders.
Visualization
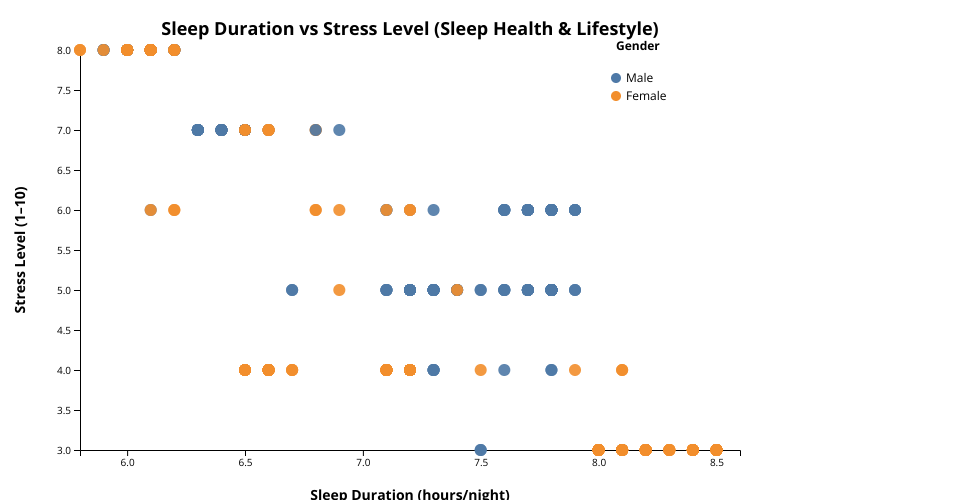
I created a scatter plot comparing Sleep Duration (hours/night) with Stress Level (1–10).
- Points are color-coded by Gender, with a clear legend.
- Tooltips show details for each person.
- Axis labels and title are bold for readability.
Goal
The goal was to build a first visual of the dataset and
explore how sleep relates to stress levels.
This plot satisfies the assignment requirements and adds
extra polish with legend, labels, and tooltips.
MIT Licensed