Pricing
Resources
Contact
Log in
Michael Bruno
@Brunomike
Public vizzes
Starred vizzes
Public vizzes
Sort by
Most recent
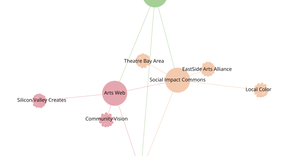
Organization Graph Diagram
Michael Bruno
Mar 06, 2023
Force Directed Graph Starter
1
Michael Bruno
Mar 06, 2023
Voronoi Overlay with Labels
Michael Bruno
Mar 05, 2023
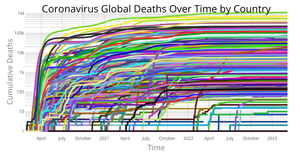
Coronavirus Deaths Over Time by Country with Voronoi Overlay
1
Michael Bruno
Mar 05, 2023
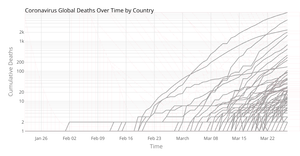
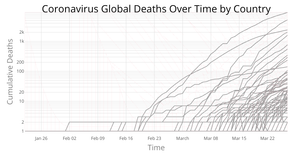
Coronavirus Deaths Over Time by Country
1
Michael Bruno
Mar 01, 2023
Visualization Labels
1
Michael Bruno
Mar 01, 2023
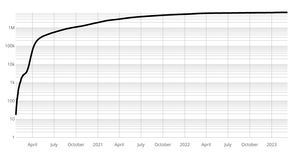
Coronavirus Log Y Axis
1
Michael Bruno
Feb 28, 2023
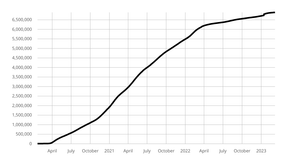
Coronavirus Linear Y Axis
1
Michael Bruno
Feb 28, 2023
React + D3 Axes
1
Michael Bruno
Feb 28, 2023
Fork of Coronavirus Line Chart with 10,000 Marker Line
1
Michael Bruno
Feb 27, 2023
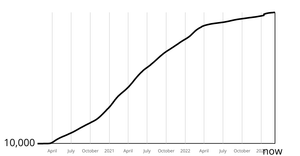
Coronavirus Line Chart with 10,000 Marker Line
1
Michael Bruno
Feb 27, 2023
Summarizing Coronavirus Data
Michael Bruno
Feb 27, 2023
Loading and Parsing Coronavirus Data
1
Michael Bruno
Feb 24, 2023
Loading and Parsing CSV Data
1
Michael Bruno
Feb 15, 2023
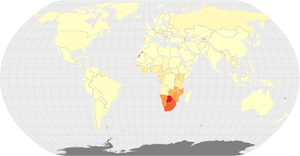
HIV/AIDS Choropleth Map
Michael Bruno
Feb 15, 2023
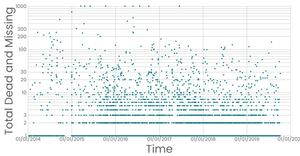
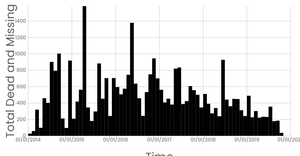
Missing Migrants Scatter Plot Log Scale
Michael Bruno
Feb 13, 2023
Analyzing Missing Migrants with Brushing
Michael Bruno
Feb 13, 2023
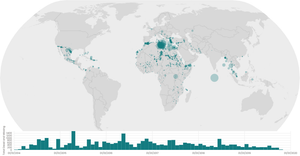
Missing Migrants on a Map and a Histogram
1
Michael Bruno
Feb 12, 2023
Analyzing Missing Migrants
Michael Bruno
Feb 12, 2023
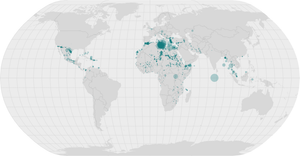
Missing Migrants on a Map
2
Michael Bruno
Feb 12, 2023
Sized Points on a Map
1
Michael Bruno
Feb 12, 2023
Points on a Map
1
Michael Bruno
Feb 12, 2023
Scatter Plot with Interactive Color Legend
Michael Bruno
Feb 03, 2023
Scatter Plot with Color Legend
4
1
Michael Bruno
Feb 03, 2023
Scatter Plot with Color
1
Michael Bruno
Feb 03, 2023
Polished Scatter Plot with Menus
1
Michael Bruno
Feb 02, 2023
Scatter Plot with Menus
1
Michael Bruno
Feb 02, 2023
Menus with React
Michael Bruno
Feb 02, 2023
React Starter
1
Michael Bruno
Feb 02, 2023
World Map
1
Michael Bruno
Feb 02, 2023
Working with Time
2
Michael Bruno
Feb 02, 2023
Fork of Stylized Scatter Plot
2
Michael Bruno
Feb 01, 2023