A visualization constructed using the vega-lite-api.
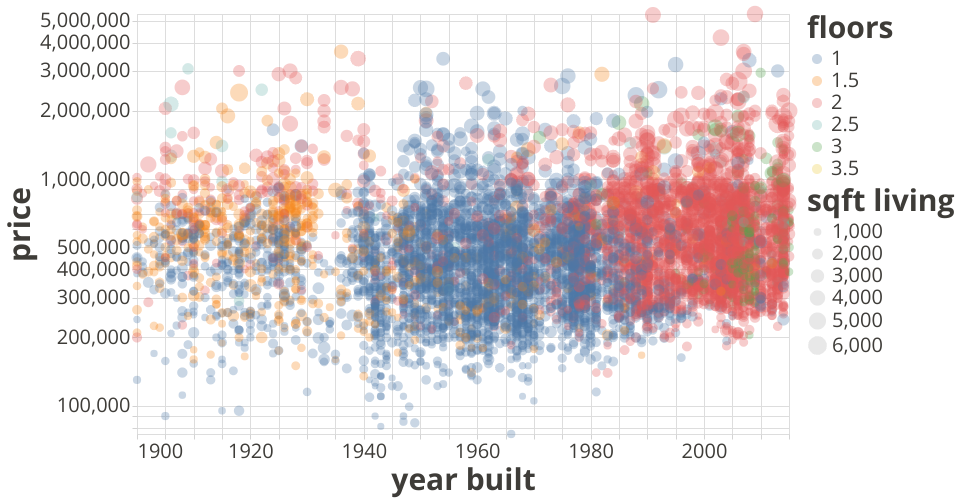
This visualization shows 2015 Seattle House Price data. It's a Scatter Plot designed to emphasize clustering of prices, year built, floors of the house, and living areas.
Each circle represents a certain house. The size of the circle represents living areas of the house. Different colors represents floor numbers.
MIT Licensed