
HW5 - Marks and Channels
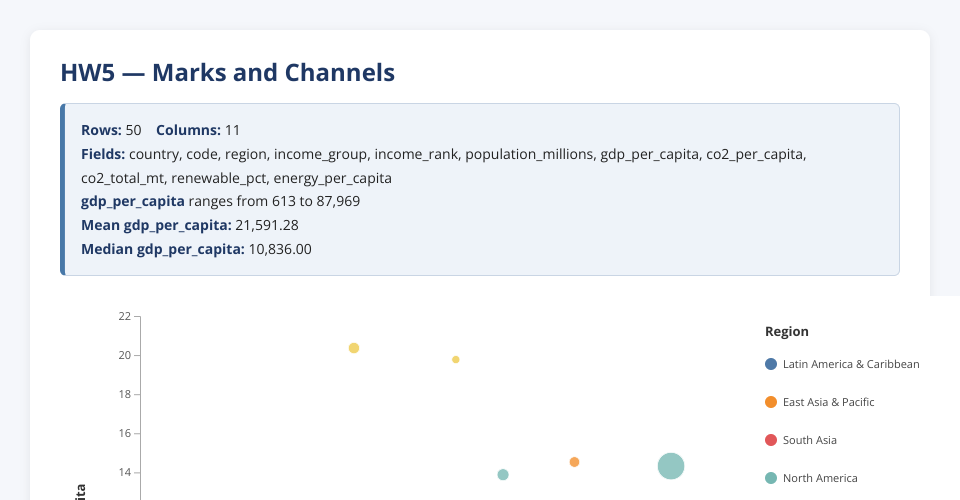
A React + D3 visualization showing the relationship between GDP per capita and CO2 emissions per capita across different countries.
Visualization Features
- X Axis: GDP per Capita (USD)
- Y Axis: CO2 per Capita (metric tons)
- Mark: Circles
- Size Channel: Population (millions)
- Color Channel: Region (Asia, Europe, North America, South America, Oceania)
Files
App.jsx- Main React componentviz.js- Visualization orchestratorrenderScatter.js- D3 scatter plot rendererdata.js- Sample country datastyles.css- Stylingindex.jsx- React entry pointindex.html- HTML template
Running
MIT Licensed