Stacked Bar Chart with D3.js
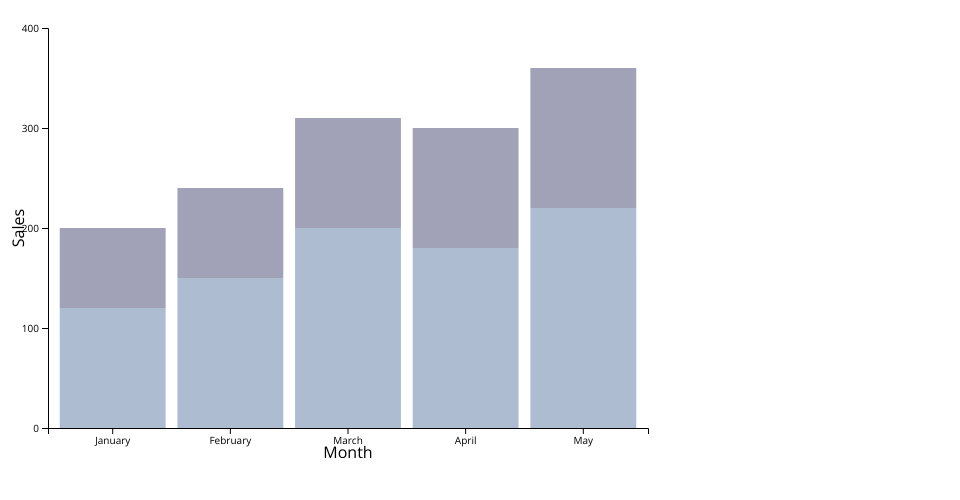
This repository contains code for creating a stacked bar chart using D3.js library. The stacked bar chart visualizes monthly sales data for two products over a period of time.
Overview
The stacked bar chart is created using HTML, CSS, JavaScript, and the D3.js library. It displays the sales data for two products ('product1' and 'product2') over five months (January to May). Each bar represents the total sales for both products in a specific month.
Files
index.html: HTML file containing the structure of the web page and JavaScript code for generating the stacked bar chart.style.css: CSS file for styling the chart elements.script.js: JavaScript file containing the code for creating the stacked bar chart using D3.js.d3.v7.min.js: D3.js library file (version 7) for data visualization.
MIT Licensed