The impact of genre on movie ratings
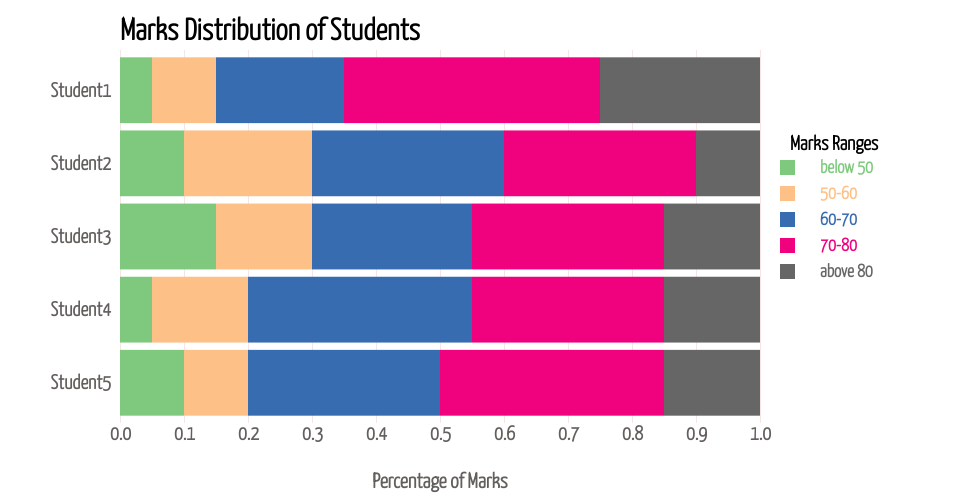
This stacked bar chart represents the percentage distribution of different mark ranges across various students. The aim is to visualize how student performance varies across different mark levels. When the mouse hovers over a segment of the bar, a tooltip displays the precise percentage of that particular mark range for the selected student. The total percentage adds up to 1, indicating 100%.
MIT Licensed