
HW5 - Marks and Channels: Video Game Sales, Scores & Playtime
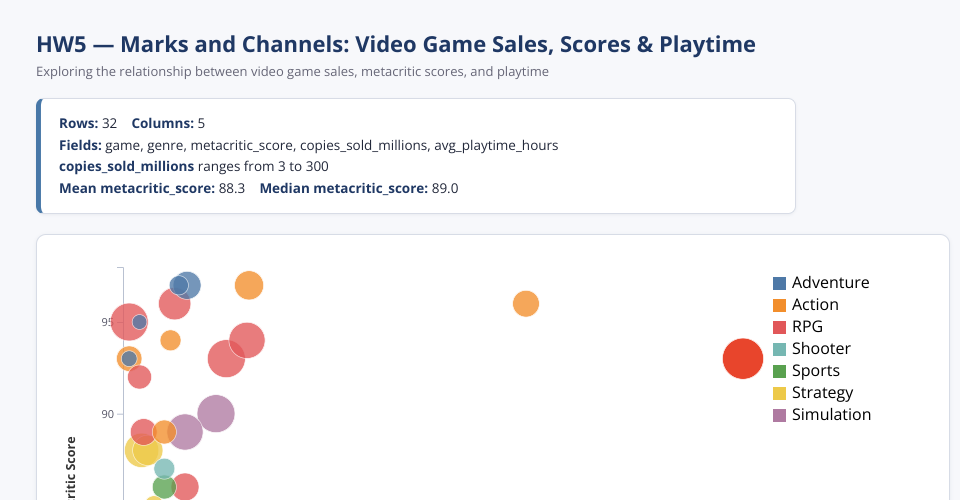
A D3.js scatter plot visualization exploring the relationship between video game sales, metacritic scores, and playtime.
Encoding
- X position: Copies sold (millions) - quantitative
- Y position: Metacritic score - quantitative
- Hue (color): Genre - categorical
- Size (area): Average playtime (hours) - quantitative
- Highlight: Minecraft receives special emphasis with distinct color and stroke
Data Source
Video game dataset from gist (see DATA_URL in index.js)
MIT Licensed