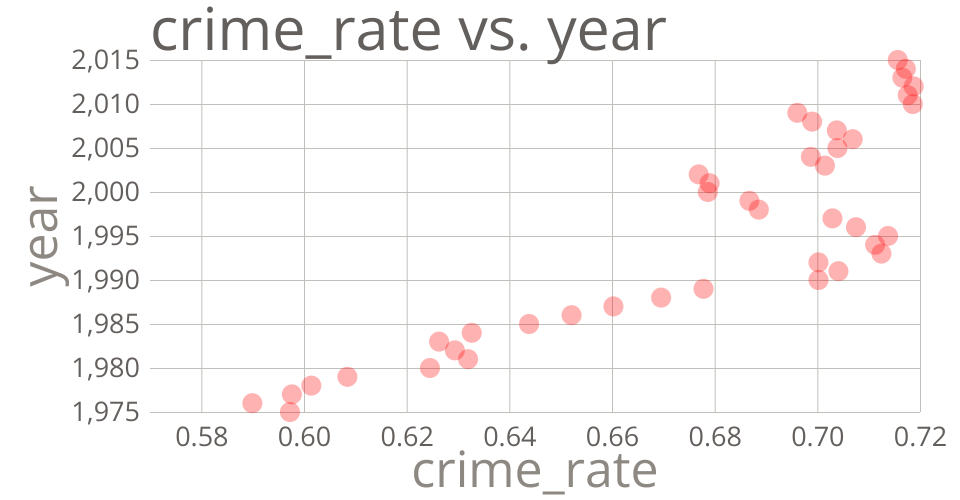
This scatter plot shows relationship between crime_rate and year, from U.S. Metro Areas Violent Crime Rates by Type. The crime rate is calculated using total number of crimes in each year divided by total number of populations.
MIT Licensed
This scatter plot shows relationship between crime_rate and year, from U.S. Metro Areas Violent Crime Rates by Type. The crime rate is calculated using total number of crimes in each year divided by total number of populations.