Description:
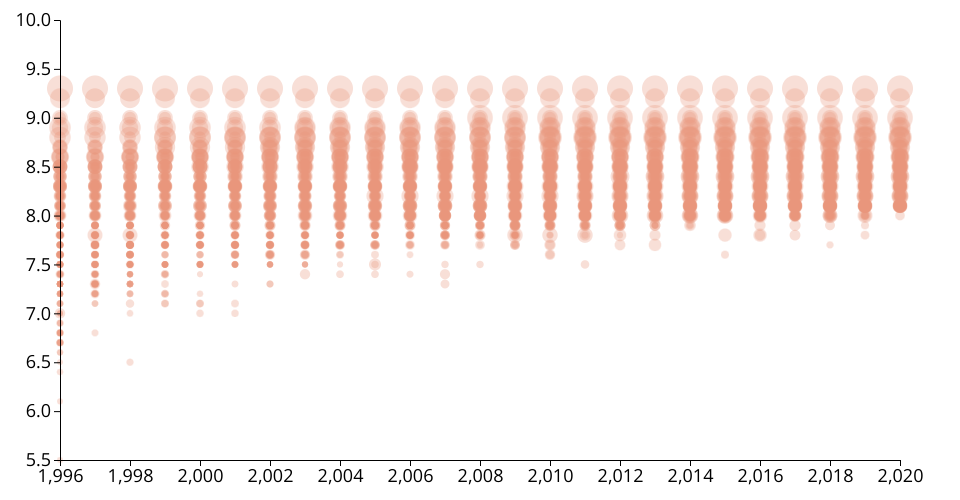
The scatter plot visualizes the IMDb Top 250 Dataset. It is designed to depict the ratings of the top 250 movies in each year.
Representations:
- X-axis: IMDb year
- Y-axis: Rating (0-10.0)
- Dots: Each dot represents a movie. The radius of the dot represents the number of votes. Larger radius means more votes.
MIT Licensed