Description:
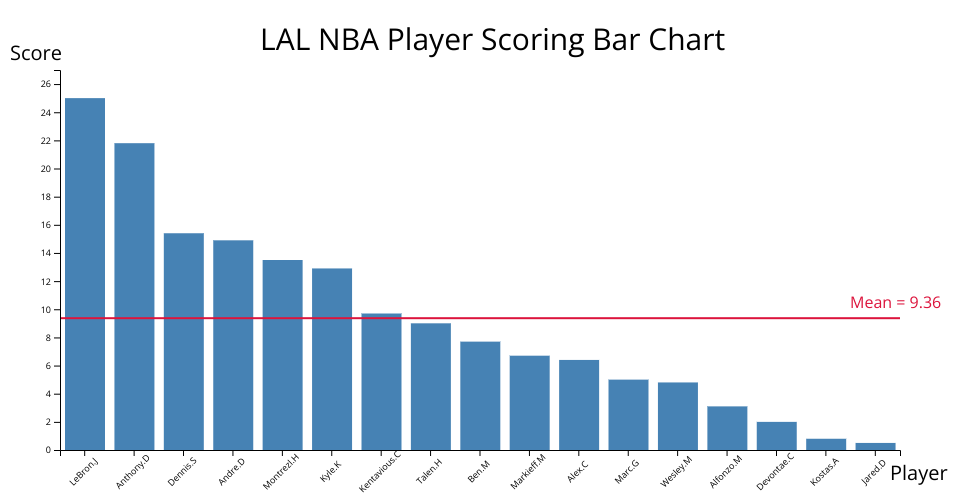
The bar chart visualizes the NBA Player State Dataset. It iterates the previous version, which is designed to depict LAL players score per game in 2020-2021 season. A horizontal line is depicted in the chart to emphasize the mean score.
Representations:
- X-axis: Player's name
- Y-axis: Score
- Bar: Each bar represents a player in LAL.
- Mean Line: The red horizontal line in the chart depicts the mean score of the team.
What's new in this version:
- Fixed the overlapping on X-axis by rotating the texts and shortening the players' names.
- Added a horizontal line to show the mean of the score.
- Added hover effect to each bar and show the accurate point when mouse over.
- Sorted the scores in descending order.
- Added a title to the chart.
MIT Licensed