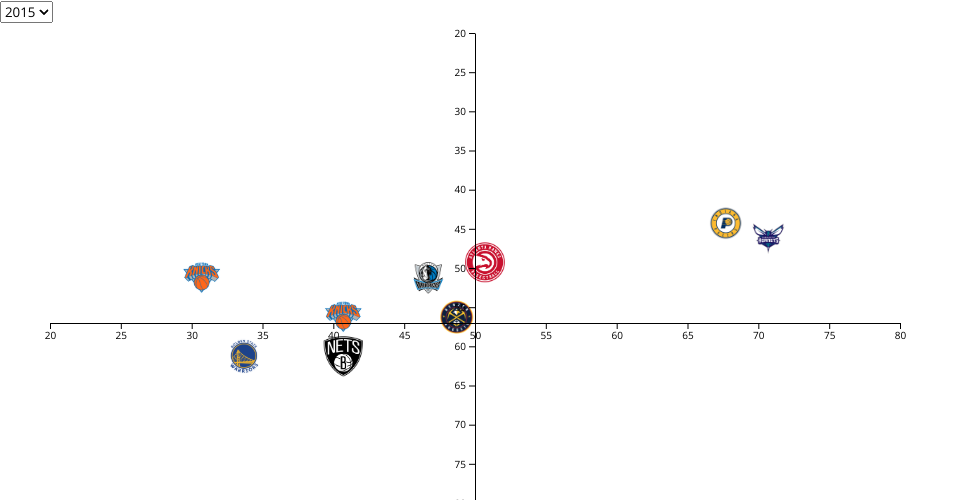
In this week's protoco, I add menu into the graph and let users to select three differnent years to get different data.
In this week, I try to add more interaction in the graph, when player click the graph, that can show another ScatterPlot to them. I am still working on that, and I am also try to add a Unite state map combine with each team. The hard point is I can only find the united State map based on state or countries, but my dataset is based on different cities. I am trying to decide a correct form to show that.
MIT Licensed