A visualization constructed using the vega-lite-api.
Question related with this dataset
- geo distribution of crime in map?
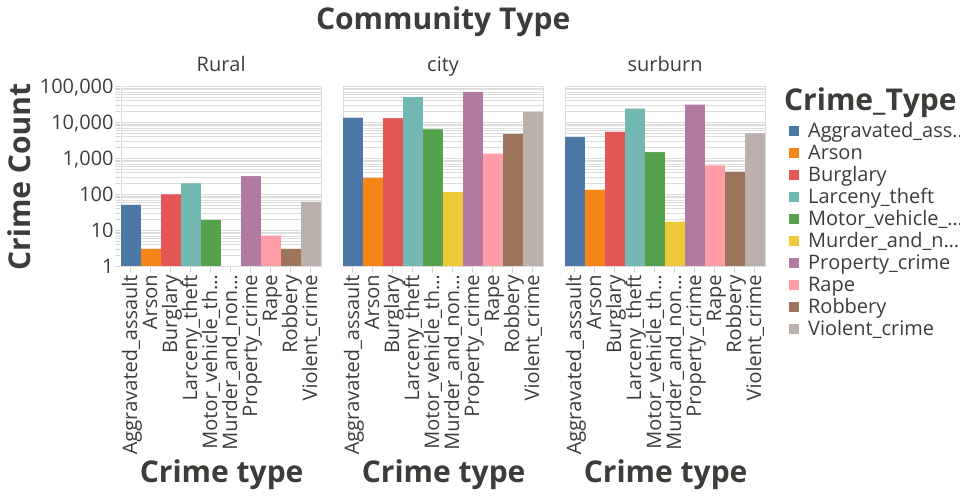
- any crime type difference in city, suburban, and rural
- what are the top 5 crime/population in massachusetts?
I try to implement a visual to show 2.
the orignal dataset structure did not support, I have to unpivot I tried to use function of vega lite. but found there is a pivot function, but unpivot is not support yet. I end up unpivoting it in excel and load to the gist.
since rural area has very few record, while city has much more record, I have to use log scale to show rural. This might not a best options to show. Since the height may be distorted during to log scale. 100% stack column chart can show proportion better.
I forked Curran's normalized stack chart and modify a bit. see here.
This clearly indicated rural area has more burglary and property crime, probably due to few people.
dateset intro is here
Gist is from here