A visualization constructed using the vega-lite-api.
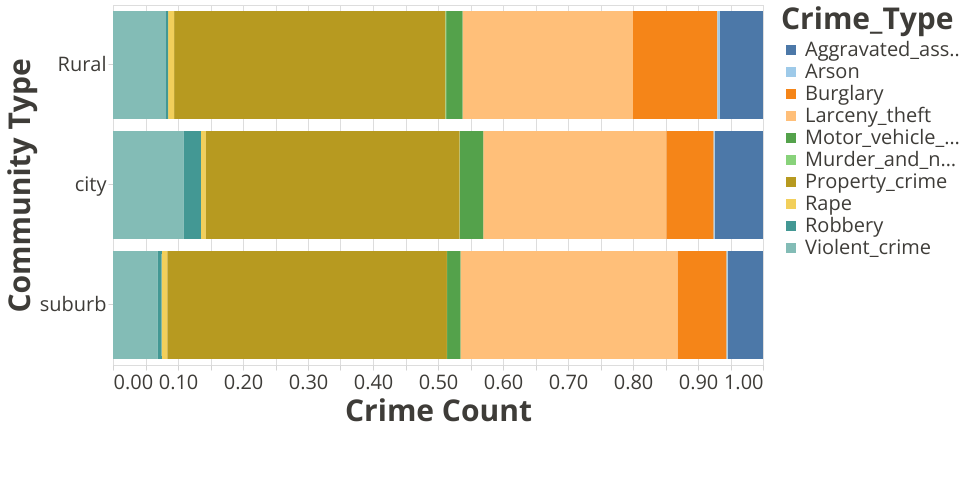
Crime dataset is unpivot and reloaded in gist repository. This is used to visualize crime distribution in different community. Use 100% stack column chart. From the Chart, rural area have more Burglary, which city has more Robbery, Motor Viechil theft as well as violent crime
dateset intro is here
Gist is from here
modification for final project
- Change from column chart to bar chart so that it is easier to compare the proportion visually
- add additional tool tip to be user-friendly
MIT Licensed