A visualization constructed using the vega-lite-api.
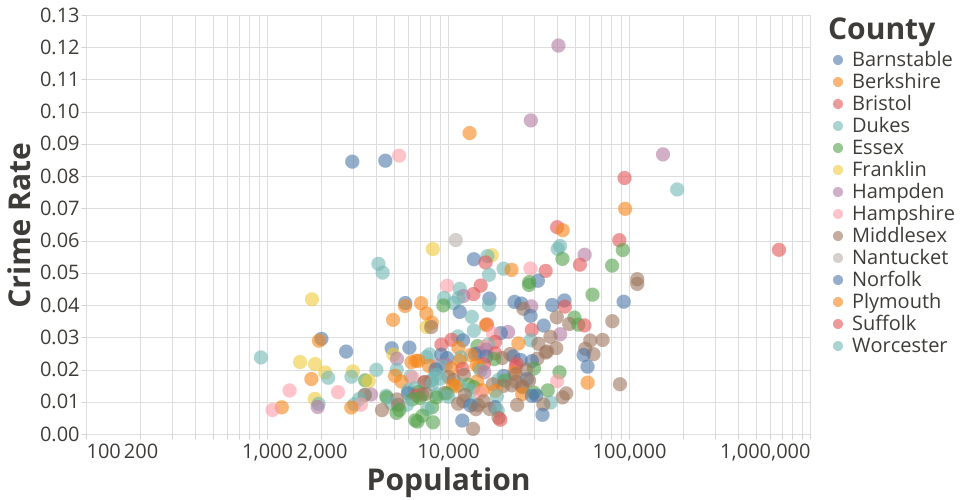
Crime dataset has been visualized. At similar range of population, New Bedford, fall river has higher Burglary crime
dataset intro is here
Gist is from here
Modification
Select population and crime rate to form a scatter plot, so at similar population range, we can compared city crime rate.
Colored by county with tool tip, so user can easily tell Hampden county has higher crime.
MIT Licensed