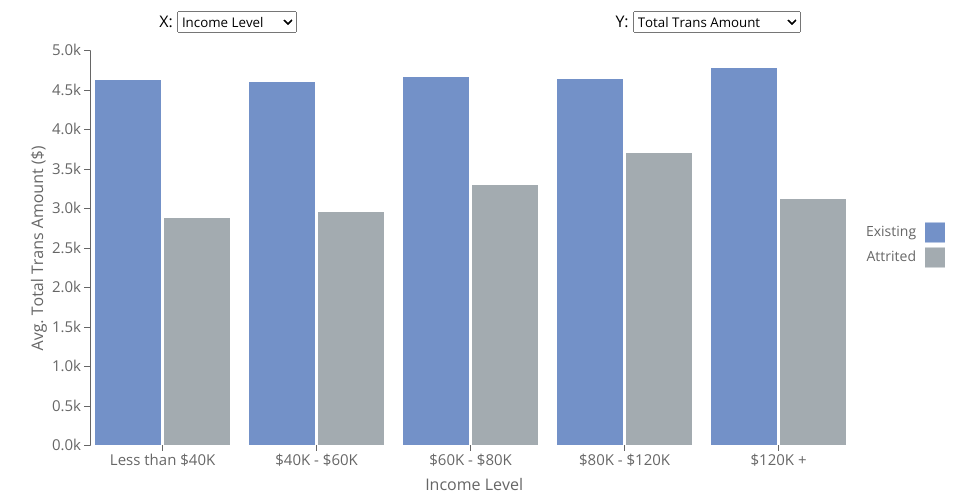
A clustered bar chart using D3 displaying data of credit card utilization from the Bank Customers Dataset.
The two menus at the top enable the users to choose which columns to be presented. For the x-axis the options are:
- Income Level
- Education Level
- Marital Status
- Card Category
- Gender
For the y-axis the options are:
- Total Transactions Amount
- Credit Limit
- Total Revolving Balance
Finally, the attrition status of the customers is encoded on the color of the bars.
MIT Licensed