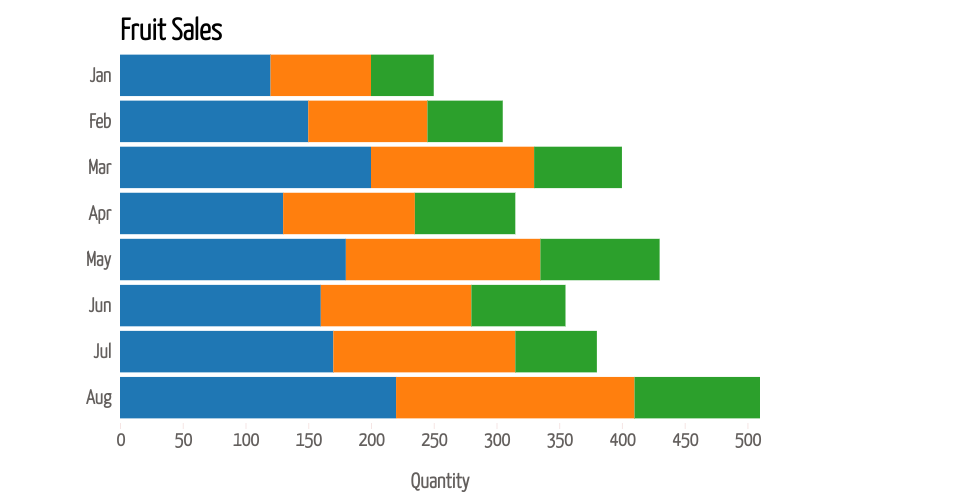
Analysis of Fruit Sales by Month
This stacked bar chart visualizes the monthly sales quantity of different fruits, including apples, bananas, and carrots. The aim is to provide an overview of fruit sales trends over time. Each bar represents a month, with segments indicating the quantity of each fruit sold. By hovering over each segment, you can view the exact quantity of fruit sold for that month. Total sales quantity is normalized to 1 for each month, representing 100%. This visualization helps to analyze the distribution of fruit sales across different months and provides insights into seasonal trends or variations.
MIT Licensed