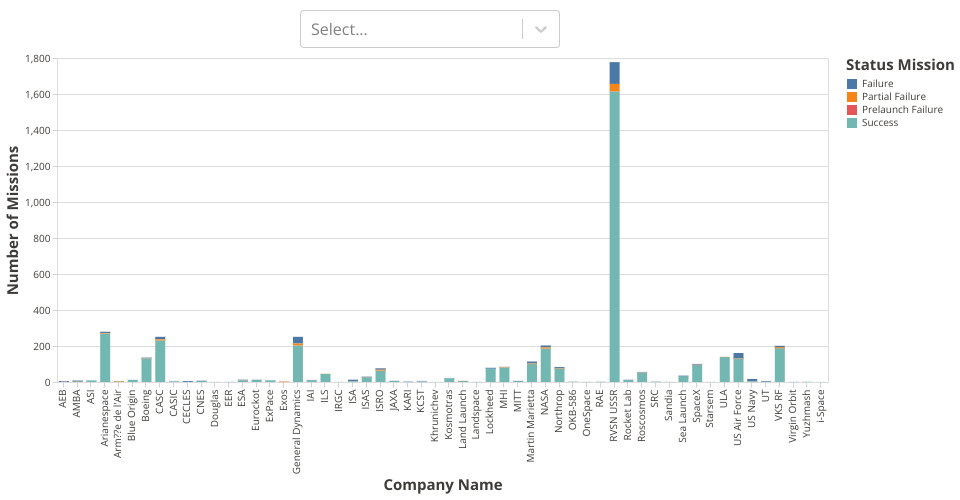
This Stacked Bar Chart shows the number of missions that were executed by each company and the status of those missions is represented by a different color and the number of missions in a particular status is shown as the tooltip on hover. The visualization is constructed using the vega-lite-api.
The dropdown allows the user to change what x-axis represents by selecting one of the attributes.
The data shown here comes from here.
MIT Licensed