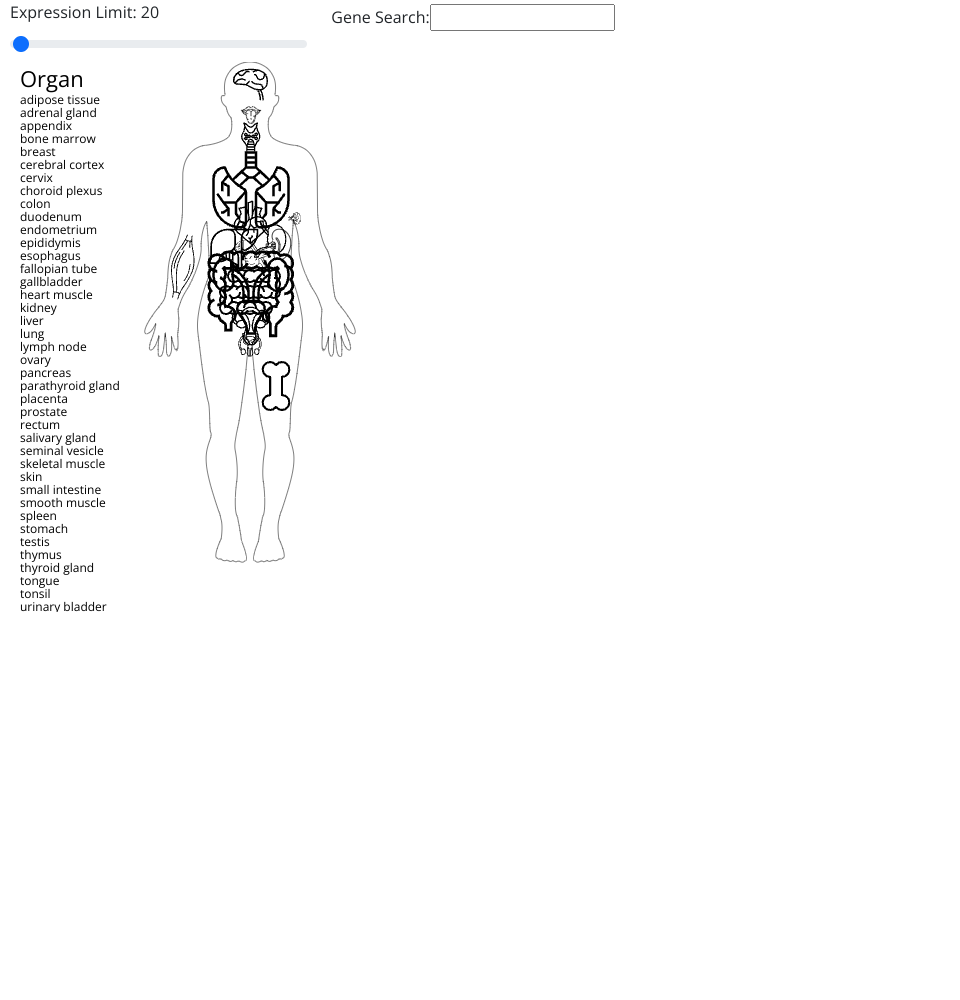
A network graph, visualizing expression and ASIF in different tissues. Select the tissue of interest on the left to view the network graph of tat tissue. Filter by a minimum expression value using the slider. The graph zoomable and panable. Zooming in shows the gene names and a visualization of the individual transcripts of that gene. Nodes are draggable. Using data from here.
MIT Licensed