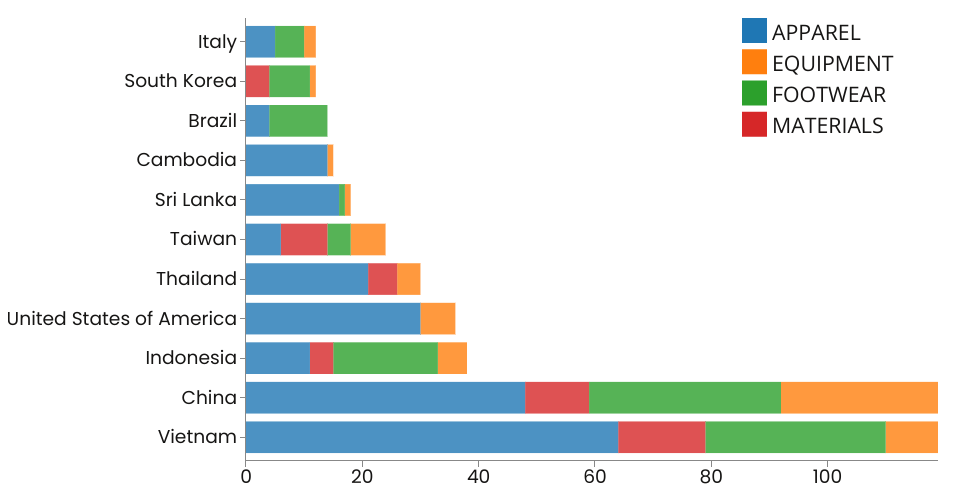
Stacked bar chart showing Nike Factory Distribution across Countries
This visualization shows Nike Global Manufacturing Data Export. It visualizes the distribution of Nike manufacturing factories all over the world based on product types they manufacture. Hovering over bars shows tooltips with number of factories and country name. Also, hovering on legend values highlights respective product category bar portions. This visualization also includes preprocessing of data such as aggregating based on country/product type, filtering and showing only countries that have overall count of factories more than 10.
MIT Licensed