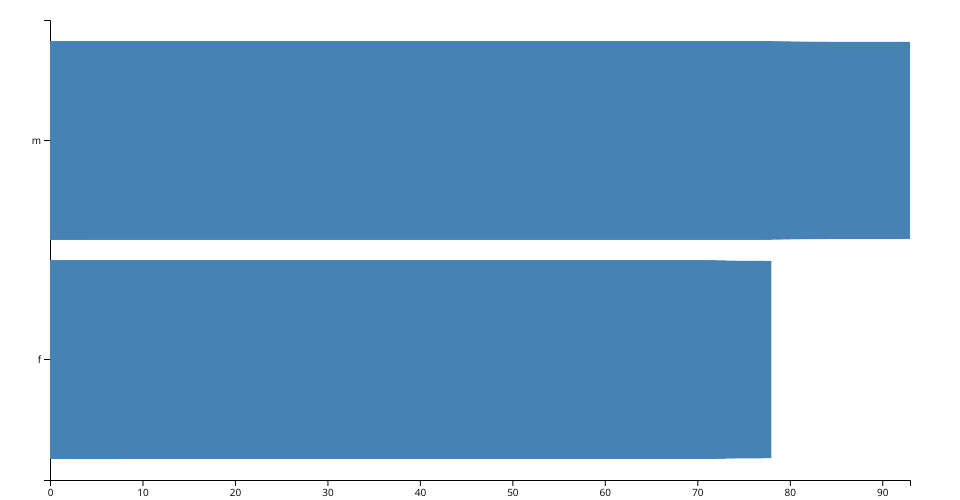
A bar chart visualization of the cdc dataset outlining general health for males and females (https://gist.github.com/ridhimasaxena/a45f4774ff99a80bb5f71ca575f64ec3).
I forked my original scatterplot (https://vizhub.com/ridhimasaxena/ce31146b95a5497d96ec57e0670ff732) to start with, but mostly used the "Making a Bar Chart with D3" video as a guide. I also looked at the two bar charts below (https://vizhub.com/RED98310/a3ea8fbec4b64423a7797a418de4af57?edit=files&file=index.js) and (https://vizhub.com/pcordone/7022e550fada4acaae8833f6150f2072?edit=files&file=index.html)to understand how to make the bar chart more interactive and stacked.
MIT Licensed