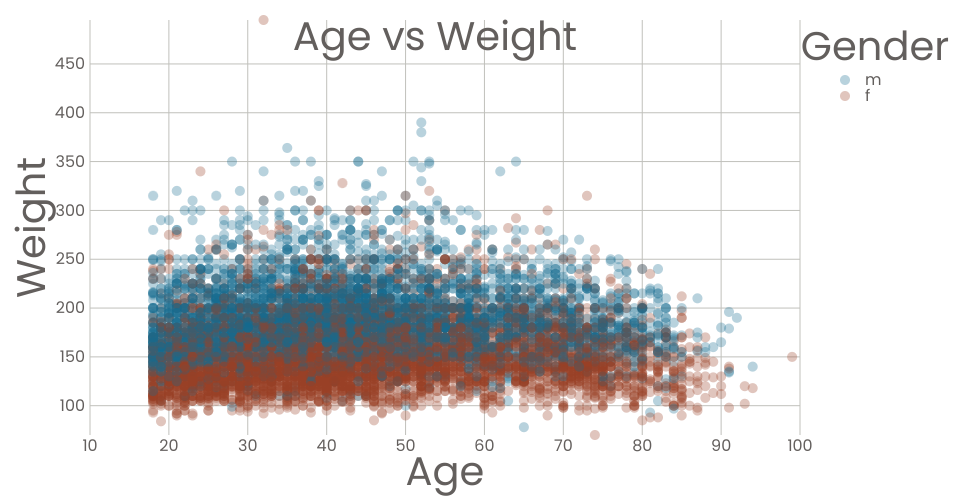
This visualization is a scatterplot of age vs. weight distinguised by gender from the CDC Dataset.
Based on the last iteration that I forked (https://vizhub.com/ridhimasaxena/ce31146b95a5497d96ec57e0670ff732), this iteration made the following changes:
- Reorganized the code into several files by adding AxisBottom.js, AxisLeft.js, bundle.js, index.js, Marks.js, and useData.js
- Added axes titles and a Title to the Graph to the visualization
- Added opacity/transparency to the plot
- Added color to the scatterplot and a color legend
- Introduced react to better construct the plot
MIT Licensed