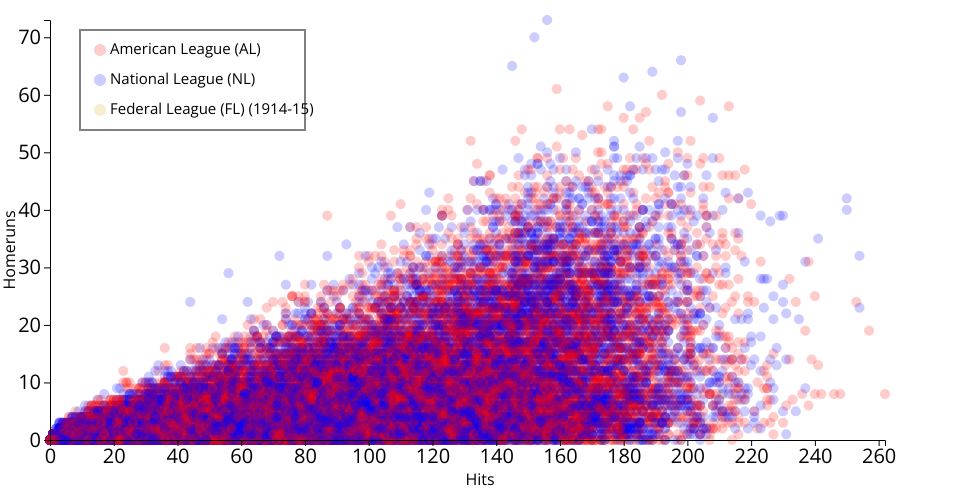
This scatter plot shows hits and homeruns using the baseball dataset. For my iteration, I did two things. Firstly, I included the Federal League in my chart. Even though it only existed from 1914-15, it played a significant role in the evolution of baseball. Secondly, I added a legend to the chart. In my original plot I colored the dots by league but I never added a legend, nor did I describe the meaning of the colors in the README. Thus, that part of the chart was not useful at all.
MIT Licensed