Iris Scatter Plot
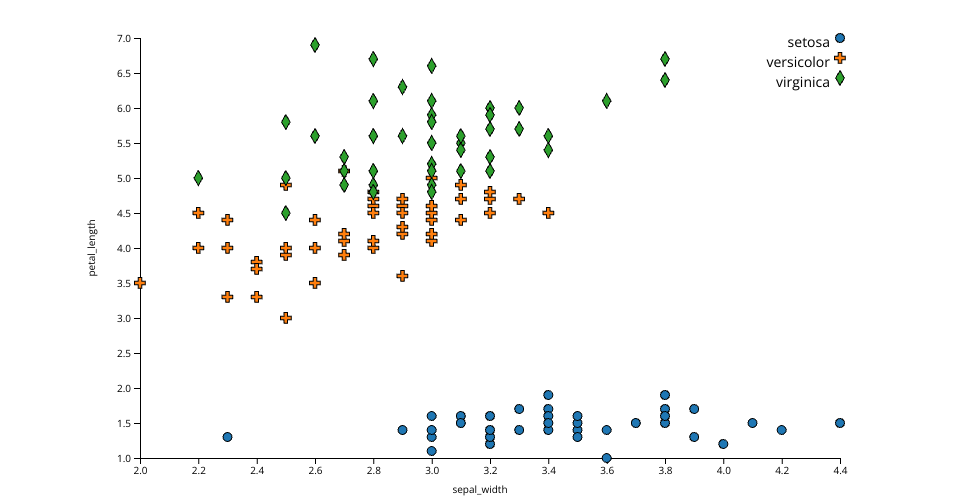
This project visualizes the famous [Iris dataset]) using a scatter plot created with D3.js. The scatter plot displays the relationships between different features of the Iris dataset, including sepal width, sepal length, petal width, and petal length. The three species of Iris flowers (setosa, versicolor, and virginica) are differentiated by different shapes in the plot.
Features
- Scatter plot visualization of the Iris dataset
- Different shapes to represent different Iris species
- Automatic switching of x-axis and y-axis features every 3 seconds
- Responsive and centered SVG element on the screen
- Legend to identify the species and their corresponding shapes
MIT Licensed