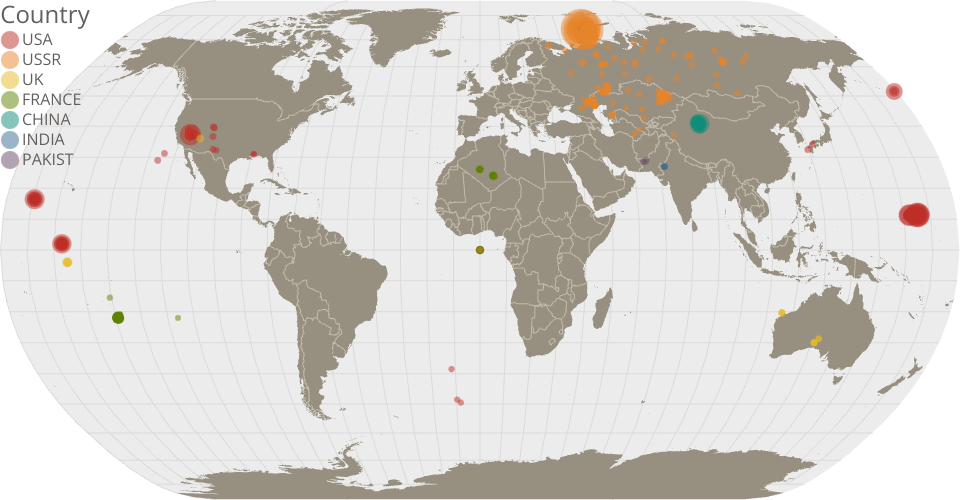
This is a visualization of the dataset Nuclear Explosions that shows where each deployment went off by latitute and longitude. The world map behind the points is a Natural Earth type map using the World Atlas TopoJSON. When the user hovers over each point, they can see the name, latitude, and logitude of that deployment. The size of each point directly corresponds to the magnitude of the explosion (the bigger the explosion, the bigger the point)! The color of each point also corresponds to which contry was responsible for the deployment of that nuclear device. Lastly, the user can interact with the color legend; when one element of the legend is hovered over, the map will only show those points.
Project Update (10/9 Deliverable): I was able to create an on click event where more information about the clicked deployment is shown in the bottom left corner. I am not sure how to put labels in front of each piece of information easily (in index.js you can see where I tried but it doesn't show). The information that shows is: name, year, source, type, and magnitude.