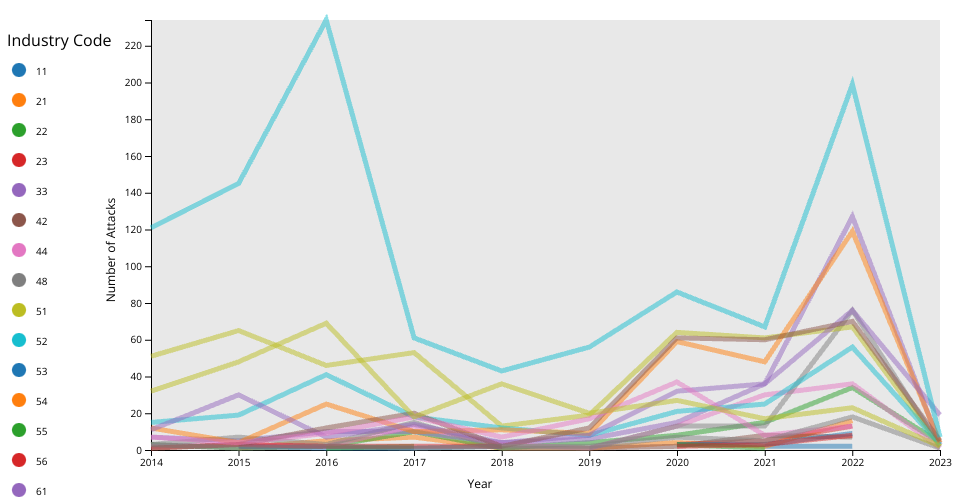
A simple line viz showing annual cyber attacks dataset from below: CISSM Cyber Attacks CISSM-EDA
v3 - Added all available data this time (2014 to 2023), with reponsive axes, multiple colored lines (one for each industry type) and a color legend color legend does not show all industry types for some reason...
Would have liked to fix the color legend and add hover over with additional data.
Week 7 Challenge
Iterate your work.
MIT Licensed
Comments
Amazing! One possible improvement here would be to snap those lines to the nearest point and show the values.
Nice! That's an excellent idea.
Try modifying this definition of the color scale to use
scaleOrdinalThat could be the cause of the issue with the color legend only showing two values.
Something like this: