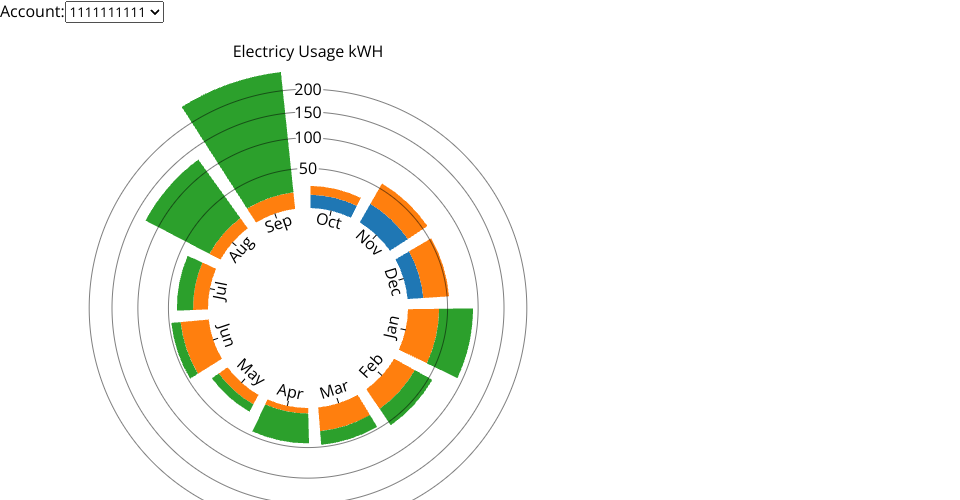
A bar chart visualization of my personal electricity consumption dataset. I live in a three family structure and occupy two floors. There is also a common account that supplies the front and back hall lighting as well as the basement and exterrior outlets. It covers a period of two years.
I forked https://vizhub.com/RED98310/a3ea8fbec4b64423a7797a418de4af57?edit=files and stated with that code. I also looked at Most basic stacked barplot in d3.js for how to render the stacked barchart.
I made the following changes from the one last week
- Added the menu to choose accounts.
- Refactored the code into a reusable d3 component.
Next steps
- I still need to get the bar graphs to update. Made progress by getting console.log to work and I can see that update is getting called.
- Wrap the bar graph around a circle that is a 12 month period.
MIT Licensed