Assignment 5 parts C, A
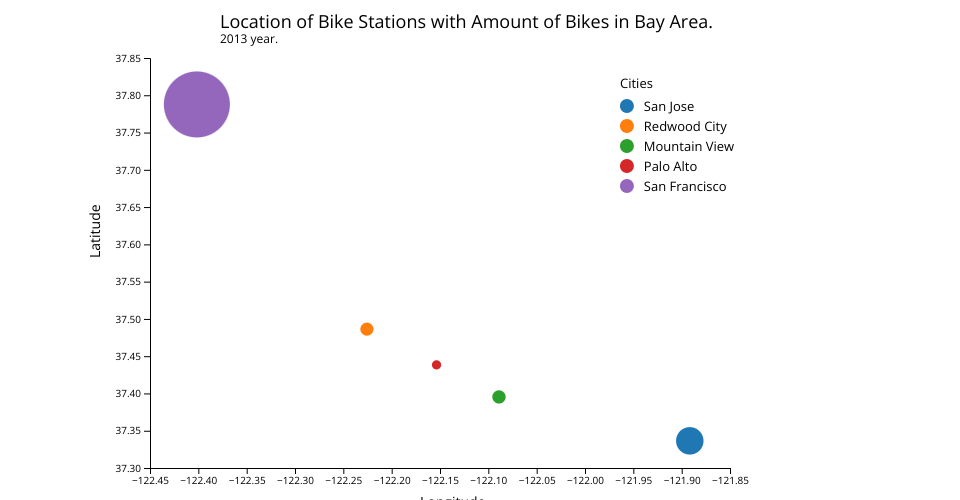
Bubble Chart with Tooltips and Legend Using D3
I've made a fork of my regular Bubble chart to add tooltip as I found it good to have information shown in a diggerent way.
Inspired by: https://observablehq.com/@d3/bubble-chart https://www.d3-graph-gallery.com/bubble Used lib: https://d3-legend.susielu.com/ used documentation: https://github.com/d3/d3/blob/main/API.md
Simple version of this bubble chart without tooltip and legend: https://vizhub.com/olga-kondr/c38fbd86a8d343e8a5c83251a0ff4f71
MIT Licensed