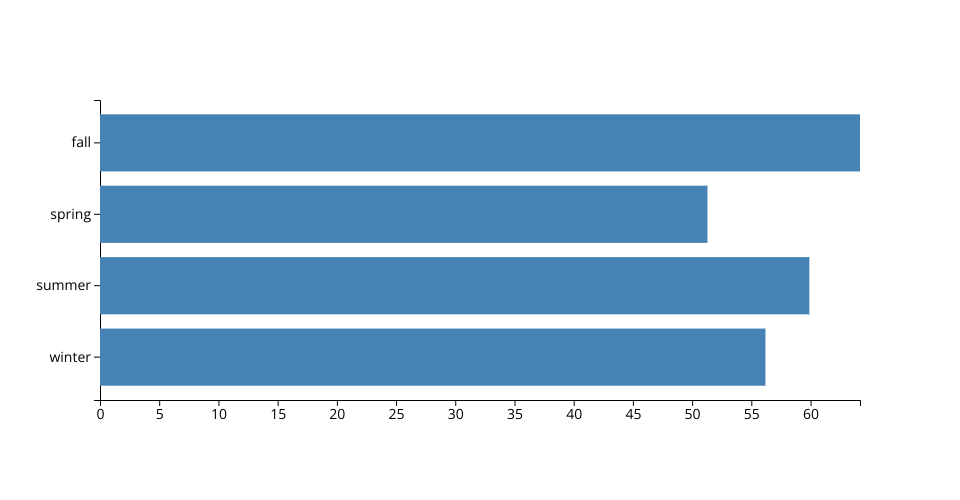
This bar chart shows the average price (eur/MWh) for energy in a given season.
The dataset is from Spain in the years 2015-2018.
The code is from this video.
MIT Licensed
This bar chart shows the average price (eur/MWh) for energy in a given season.
The dataset is from Spain in the years 2015-2018.
The code is from this video.