Chocolate Sales Data Visualization
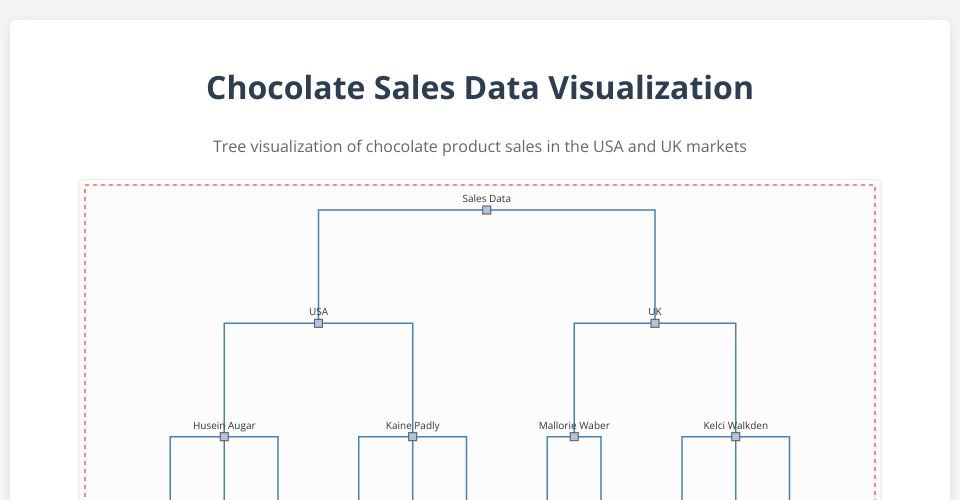
This project visualizes chocolate product sales data in the USA and UK using a hierarchical tree structure. The visualization shows sales representatives, their products, and sales values.
Features
- Vertical tree layout showing the hierarchical relationship between regions, sales representatives, and products
- Node size represents the sales value for each product
- Color-coded nodes by product category (Bars, Bites, Other)
- Interactive tooltips showing detailed information on hover
- Clean, responsive design
Technologies Used
- D3.js v7 for data visualization
- Plain JavaScript, HTML, and CSS
- No additional dependencies
How to Use
- Clone this repository
- Open
index.htmlin your browser - Explore the visualization:
- Hover over nodes to see details
- Node size indicates sales value
- Colors represent different product categories
Data Structure
The visualization uses hierarchical data with the following structure:
MIT Licensed