FEMA Disaster Data Visualization
This project visualizes disaster data from the Federal Emergency Management Agency (FEMA).
Data Source
The visualization uses data from: https://raw.githubusercontent.com/nitanagdeote/Federal-Emergency-Management-Agency-FEMA-Project/refs/heads/main/data.csv
Features
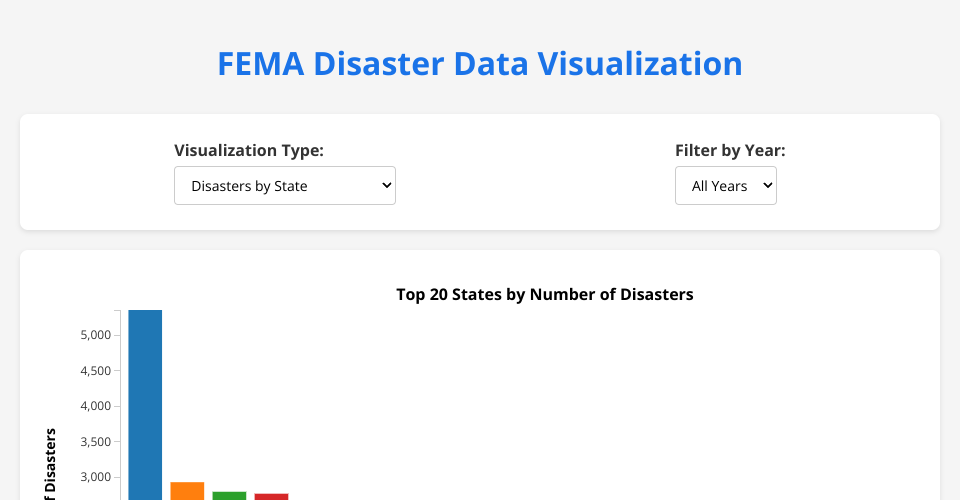
- Bar chart showing disasters by state
- Line chart showing disasters over time
- Pie chart showing distribution of disaster types
- Filter by year
- Interactive tooltips
How to Use
- Open index.html in a web browser
- Select visualization type from the dropdown
- Filter by year if needed
- Hover over chart elements to see detailed information
MIT Licensed