Car Performance Data Visualization
An interactive and responsive data visualization that displays car performance metrics using D3.js.
Features
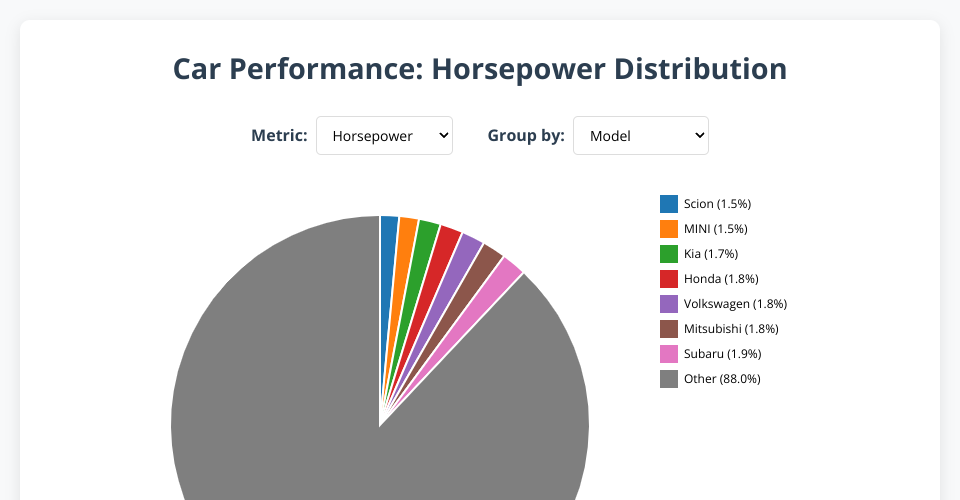
- Interactive pie chart visualization of car performance data
- Toggle between different metrics (horsepower, torque, highway MPG)
- Group data by manufacturer or individual car models
- Responsive design that works on desktop and mobile devices
- Interactive tooltips showing detailed information
- Highlighting effect when hovering over chart segments or legend items
Usage
- Open
index.htmlin a web browser - Use the dropdown menus to switch between different metrics and grouping options
- Hover over pie segments or legend items for detailed information
Technical Details
- Built with D3.js version 6
- Uses ES6 modules for better code organization
- Responsive design with CSS media queries
- Data aggregation and processing utilities
MIT Licensed