Hate Crimes in San Francisco Data Visualization
This project visualizes hate crime data in San Francisco, providing insights into patterns, bias types, and demographic information.
Overview
The visualization project includes several interactive charts that help users understand the nature and distribution of hate crimes in San Francisco:
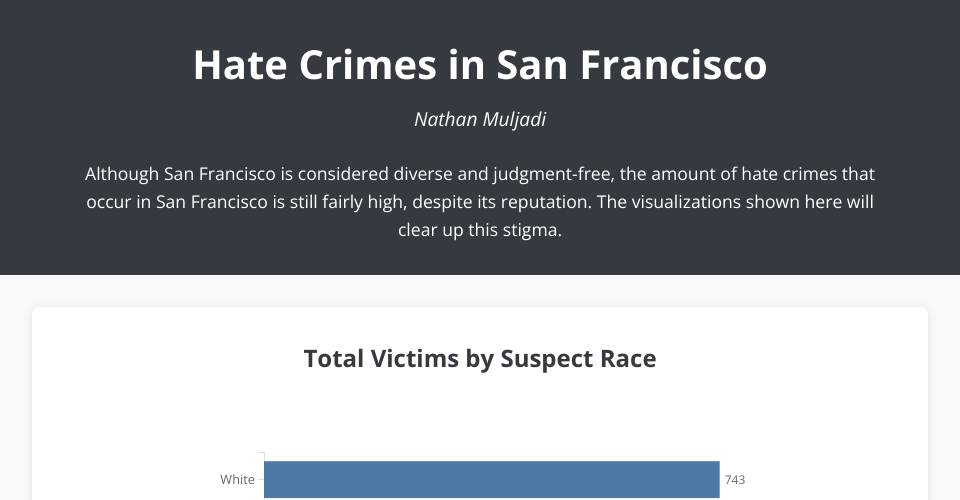
- Bar Chart: Shows the total number of victims by suspect race
- Treemap: Displays victims by bias type with proportional rectangles
- Bubble Chart: Visualizes suspect counts by race and offensive act
- Area Chart: Tracks victim count over time (months)
Technologies Used
- HTML5, CSS3 for structure and styling
- D3.js (v7) for data visualization
- Responsive design for various screen sizes
How to Use
- Open
index.htmlin a modern web browser - Hover over chart elements to see detailed information
- Explore patterns and relationships in the data
Data Source
This visualization uses data from the San Francisco Police Department's Investigated Hate Crimes dataset.
Project Structure
index.html- Main HTML filestyles.css- CSS stylingscripts/- Directory containing all JavaScript filesmain.js- Main application logicbarChart.js- Bar chart implementationtreemap.js- Treemap chart implementationbubbleChart.js- Bubble chart implementationareaChart.js- Area chart implementation
PD-Investigated-Hate-Crimes.csv- Dataset file
MIT Licensed