Iran Nuclear Timeline Visualization
This interactive timeline visualizes key events related to Iran's nuclear program, from its beginning in 1967 through hypothetical future events.
Features
- Vertical chronological display of events on an interactive timeline (newest events at the top)
- Events are color-coded by type (political, technical, military, diplomatic)
- Interactive elements:
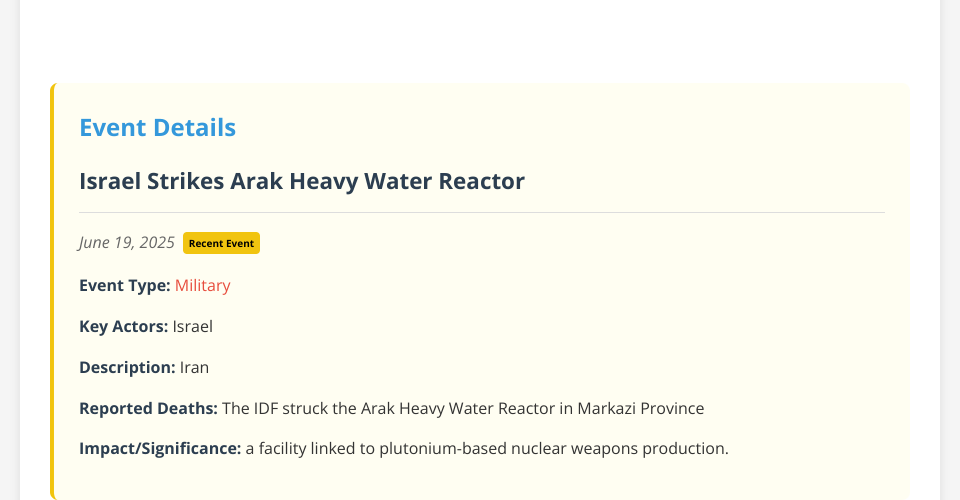
- Click on events to view detailed information
- Hover tooltips with preview information
- Zoom controls to explore dense time periods
- Automatic highlighting of selected events
- Responsive design that adapts to different screen sizes
Implementation
The visualization is built using:
- HTML5/CSS3 for structure and styling
- D3.js (v7) for data visualization
- JavaScript for interactivity
Data Structure
The timeline is populated from data.csv which contains information about:
- Event dates
- Event names
- Key actors involved
- Event descriptions
- Impact and significance
- Reported deaths (when applicable)
Usage
Simply open the index.html file in a modern web browser. No server is required as all data is loaded locally.
Browser Compatibility
The visualization works best in modern browsers that support ES6 and CSS3 features:
- Chrome (latest)
- Firefox (latest)
- Safari (latest)
- Edge (latest)
MIT Licensed