Global Hypertension Prevalence Visualization
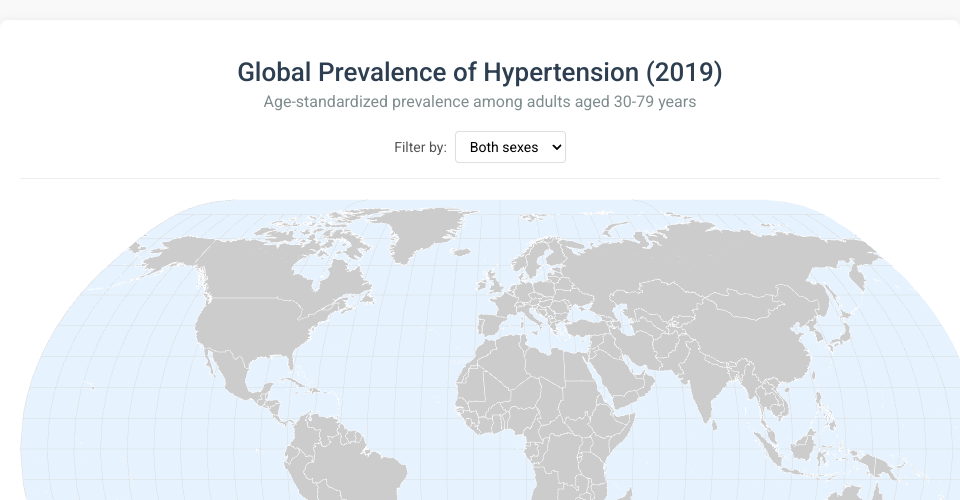
This interactive visualization shows the worldwide prevalence of hypertension among adults aged 30-79 years, based on age-standardized data from 2019.
Data Source
The data comes from the WHO Global Health Observatory, focusing on the prevalence of hypertension among adults. Hypertension is defined as having systolic blood pressure ≥140 mmHg and/or diastolic blood pressure ≥90 mmHg or using medication to lower blood pressure.
Features
- Interactive world map visualization showing hypertension prevalence rates by country
- Filter data by sex (male, female, or both)
- Color-coded map with gradient legend
- Hover tooltips showing exact prevalence values
- Responsive design for different screen sizes
Technical Implementation
Built using:
- React for component structure and state management
- D3.js for mapping, data visualization and interactive elements
- TopoJSON for efficient geographic data representation
- Modern ES6+ JavaScript
Getting Started
- Clone the repository
- Run
npm install - Start the development server with
npm start - Open your browser to
http://localhost:3000
MIT Licensed