Network Graph Visualization
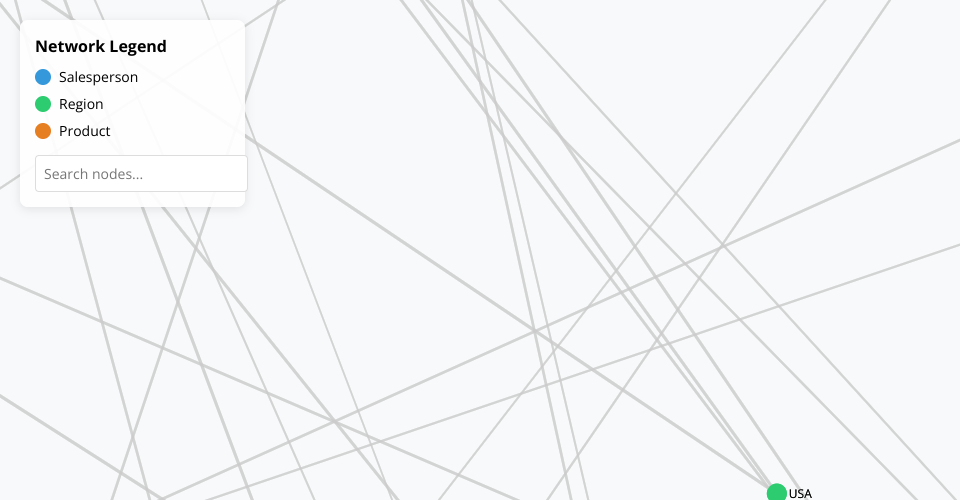
This interactive visualization displays relationships between salespeople, products, and regions using a network graph.
Features
- Interactive Network Graph: Visualizes connections between different entities
- Node Types: Color-coded nodes distinguishing between salespeople, regions, and products
- Search Functionality: Filter the graph by searching for specific nodes
- Details Panel: View detailed information about selected nodes and their connections
- Zoom & Pan: Navigate the graph with mouse controls
- Responsive Design: Adapts to different screen sizes
How to Use
- Explore the Graph: Click and drag nodes to reposition them
- View Details: Click on any node to see detailed information and highlight its connections
- Search: Use the search box to find specific nodes
- Navigate: Zoom with mouse wheel, pan by dragging the background
Technical Implementation
The visualization is built using:
- D3.js for data visualization
- Force-directed graph layout for node positioning
- Custom CSS for styling and responsive design
Data Structure
The graph represents three main entity types:
- Salespersons: Sales representatives (blue nodes)
- Regions: Geographic markets (green nodes)
- Products: Chocolate products (orange nodes)
Links between nodes represent relationships such as sales responsibility, product availability in regions, and product categorization.
MIT Licensed