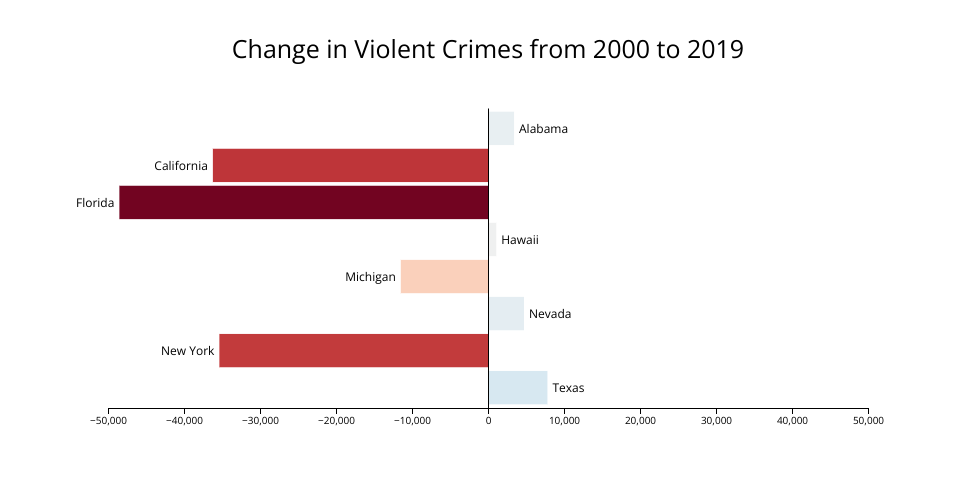
Visualization of crime rate differences by state from the CORGIS dataset made with D3. Color legend and threshold code from Susie Lu.
Hover over bars to see precise values. Fullscreen to see legend.