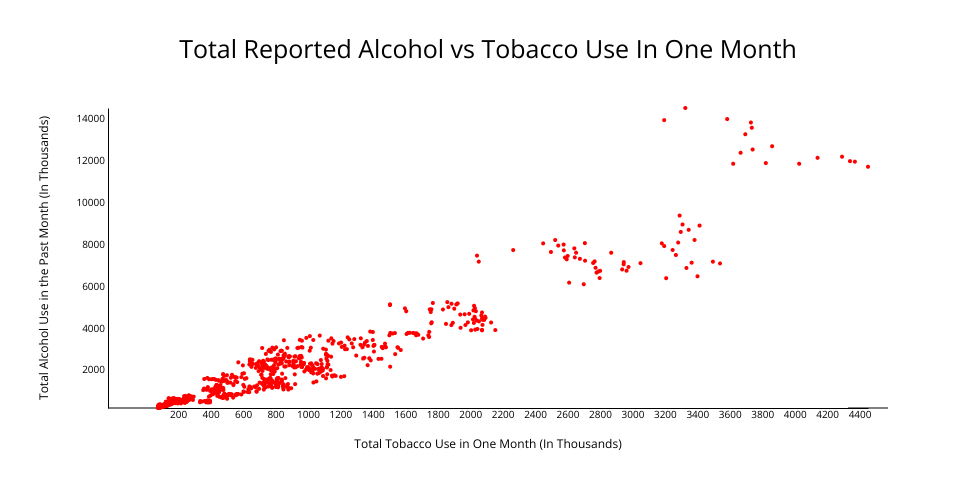
Visualization of alcohol usage vs tobacco usage from the CORGIS dataset made with D3. Implementation learned from DataVizDad on Youtube as well as the D3 Graph Gallery.
Hover over dots to see value for that point.
MIT Licensed
Visualization of alcohol usage vs tobacco usage from the CORGIS dataset made with D3. Implementation learned from DataVizDad on Youtube as well as the D3 Graph Gallery.
Hover over dots to see value for that point.