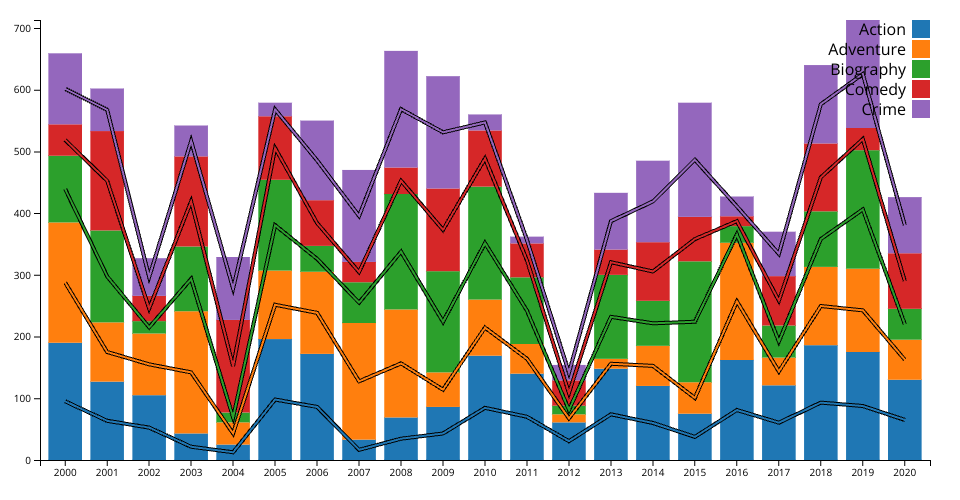
Stacked Bar Chart for Movies by Genre with Trend Lines
Chart Explanation
This chart visualizes the number of movies released per genre from 2000 to 2020 using stacked bar charts with trend lines. Each genre has its own stacked bar and corresponding trend line, showing the fluctuations in movie production for that genre over the years.
Chart Details:
- X-Axis: Represents different years from 2000 to 2020.
- Y-Axis: The total number of movies released in each genre.
- Bars: The bars are stacked, with each section representing a different genre, such as Action, Comedy, Adventure, etc.
- Trend Lines: Each genre has a corresponding trend line that shows how the number of movies in that genre changes over time.
Summary
This chart provides a clear view of how movie releases in each genre have evolved over the two decades. The stacked bars display the proportion of movies released per genre each year, while the trend lines give a more detailed view of the year-to-year changes for each genre. This allows for both a comparative view and insight into individual genre trends.
Data Note
The data used in this chart is fake data generated for demonstration purposes. It was designed to simulate movie release patterns for genres such as Action, Adventure, Biography, Comedy, and Crime over the years 2000 to 2020.